How to Install Wazuh and Connect Agents: A Step-by-Step Guide

Introduction to Wazuh: The Open Source Security Platform
Wazuh is a powerful, free, and open-source security platform designed to provide visibility into your infrastructure. It is widely used by security professionals for threat detection, integrity monitoring, and incident response. For students, Wazuh is an excellent tool to learn the fundamentals of SIEM (Security Information and Event Management) and XDR (Extended Detection and Response). It works by collecting data from your computers (agents) and analyzing it in a central manager to find security threats, misconfigurations, or unauthorized changes.
What You Will Learn in This Tutorial
This document is a step-by-step visual guide designed to help you navigate the Wazuh interface and understand its core features. By following this tutorial, you will learn:
● How to interpret the Wazuh dashboard.
● How to monitor agent health and security events.
● How to identify and analyze security alerts.
Downloading the Wazuh OVA
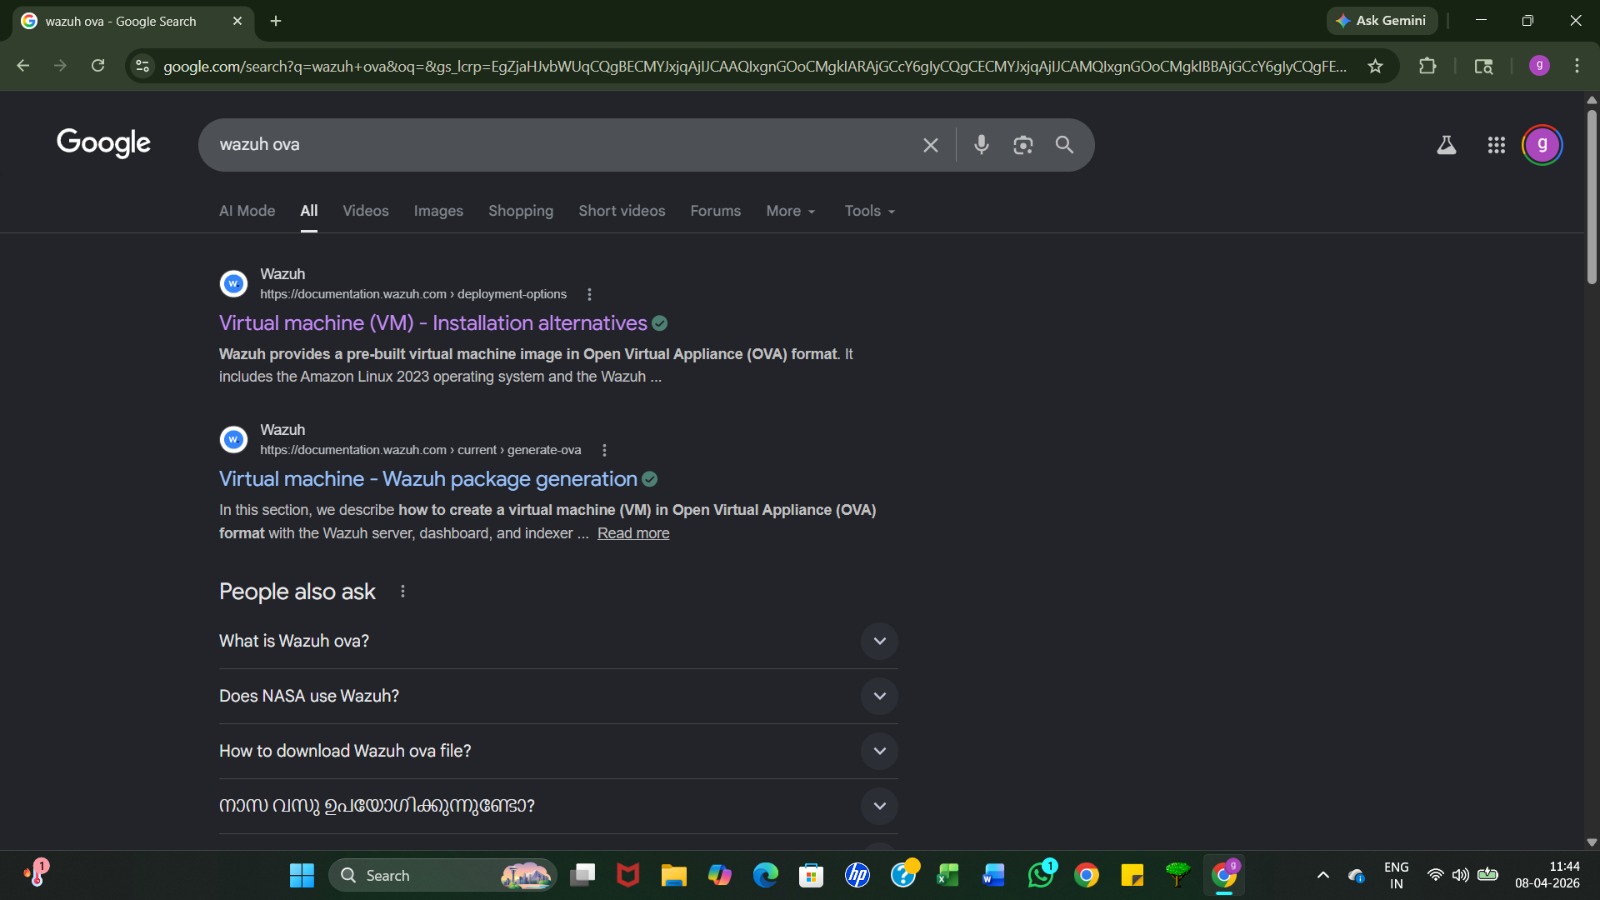
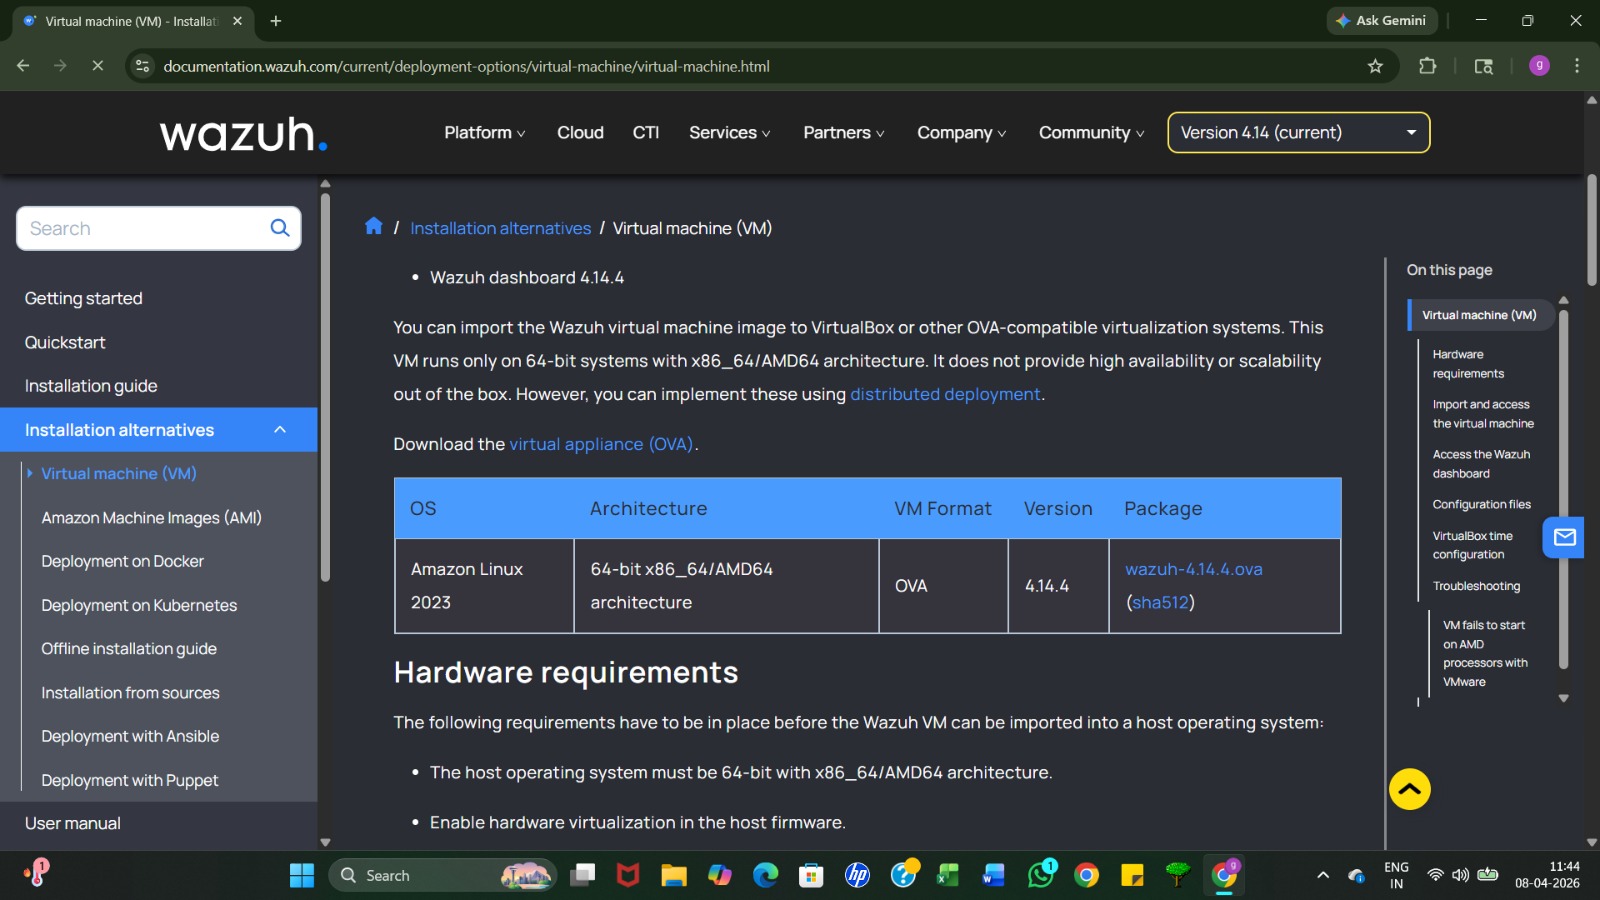
Search for "Wazuh OVA" to find the official pre-built virtual machine image. Click on the link for "Virtual machine (VM) - Installation alternatives" to access the download page. Using the OVA file is the fastest way for students to set up a full Wazuh lab environment in VirtualBox or VMware.
Importing the Appliance into VirtualBox
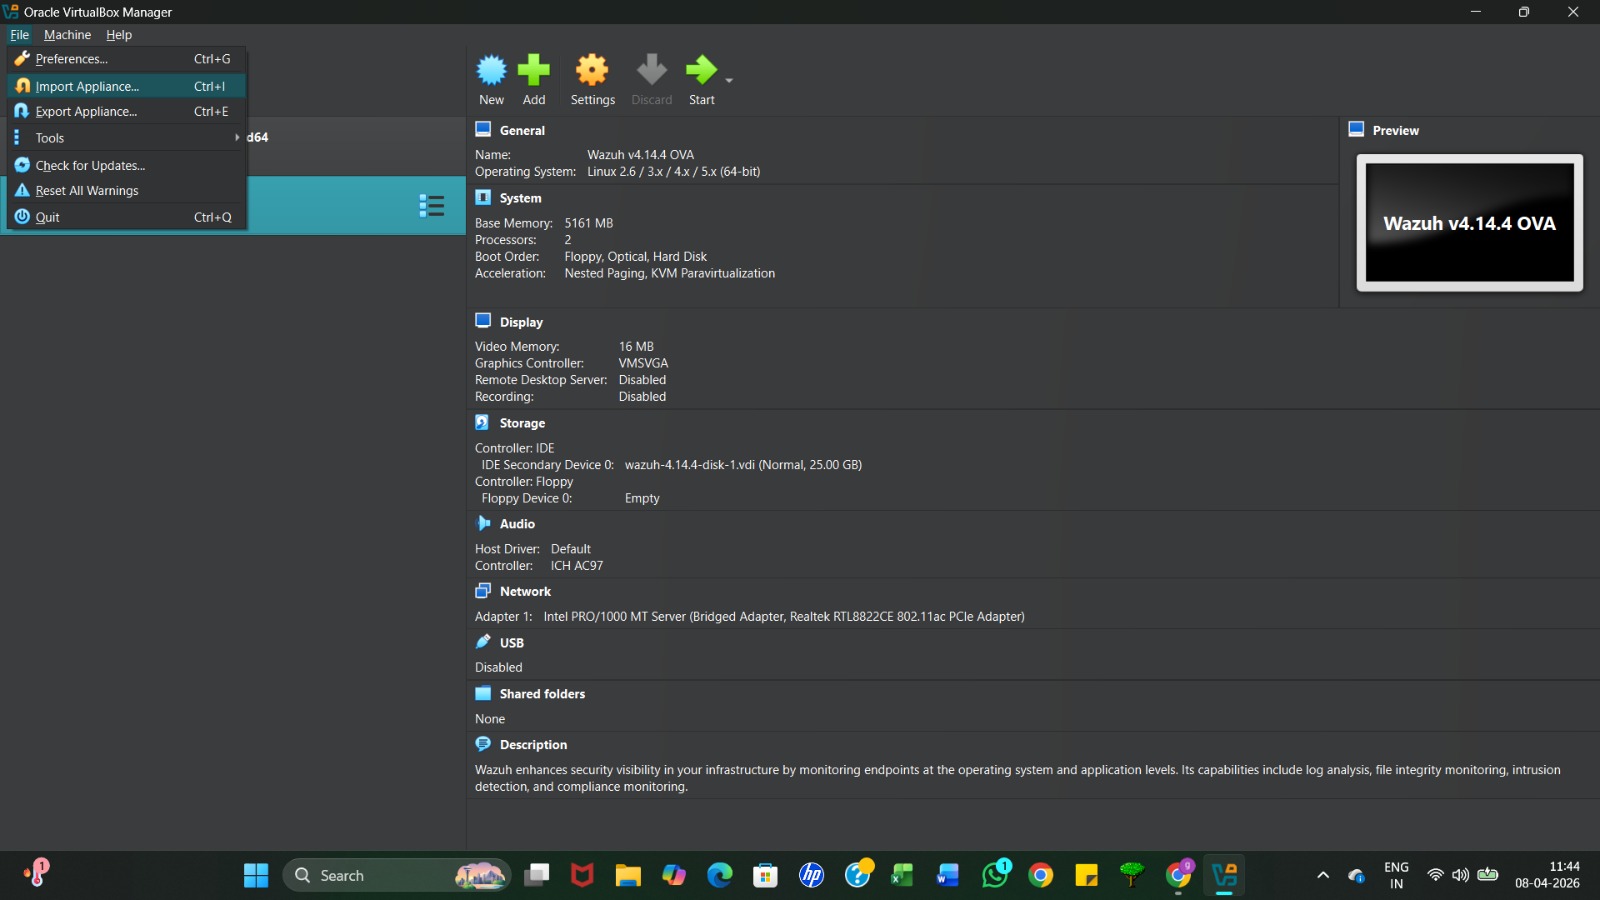
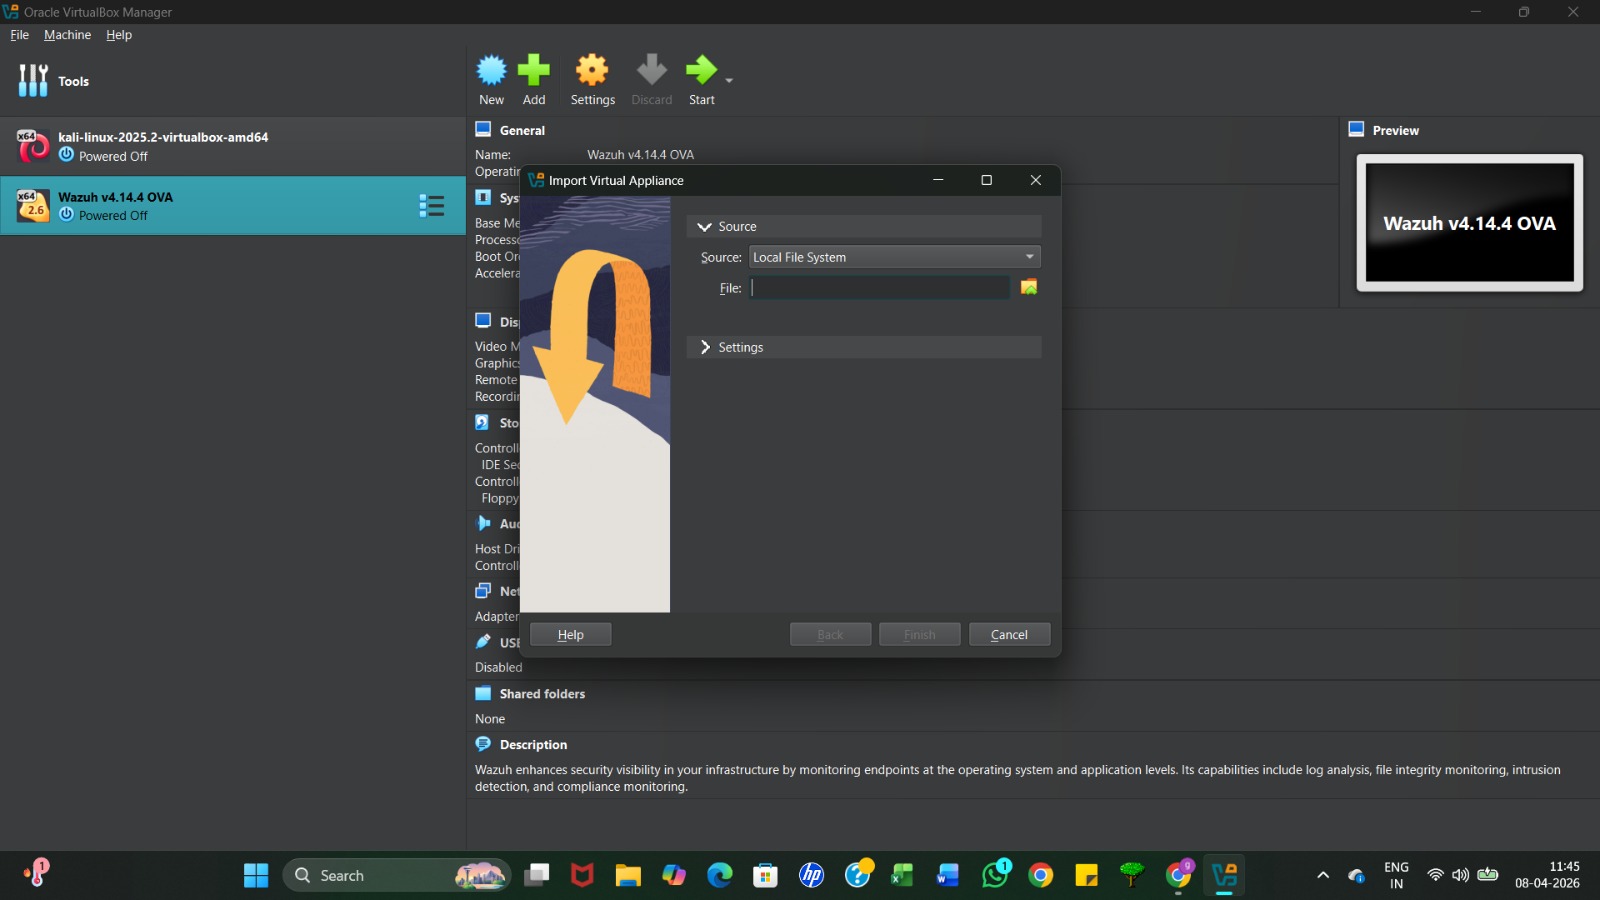
Open Oracle VM VirtualBox and navigate to File > Import Appliance (or press Ctrl+I). In the pop-up window, click the folder icon to browse your local files and select the downloaded Wazuh OVA file. Click Next to proceed with the automated configuration, which sets up the necessary CPU, RAM, and storage settings for the server.
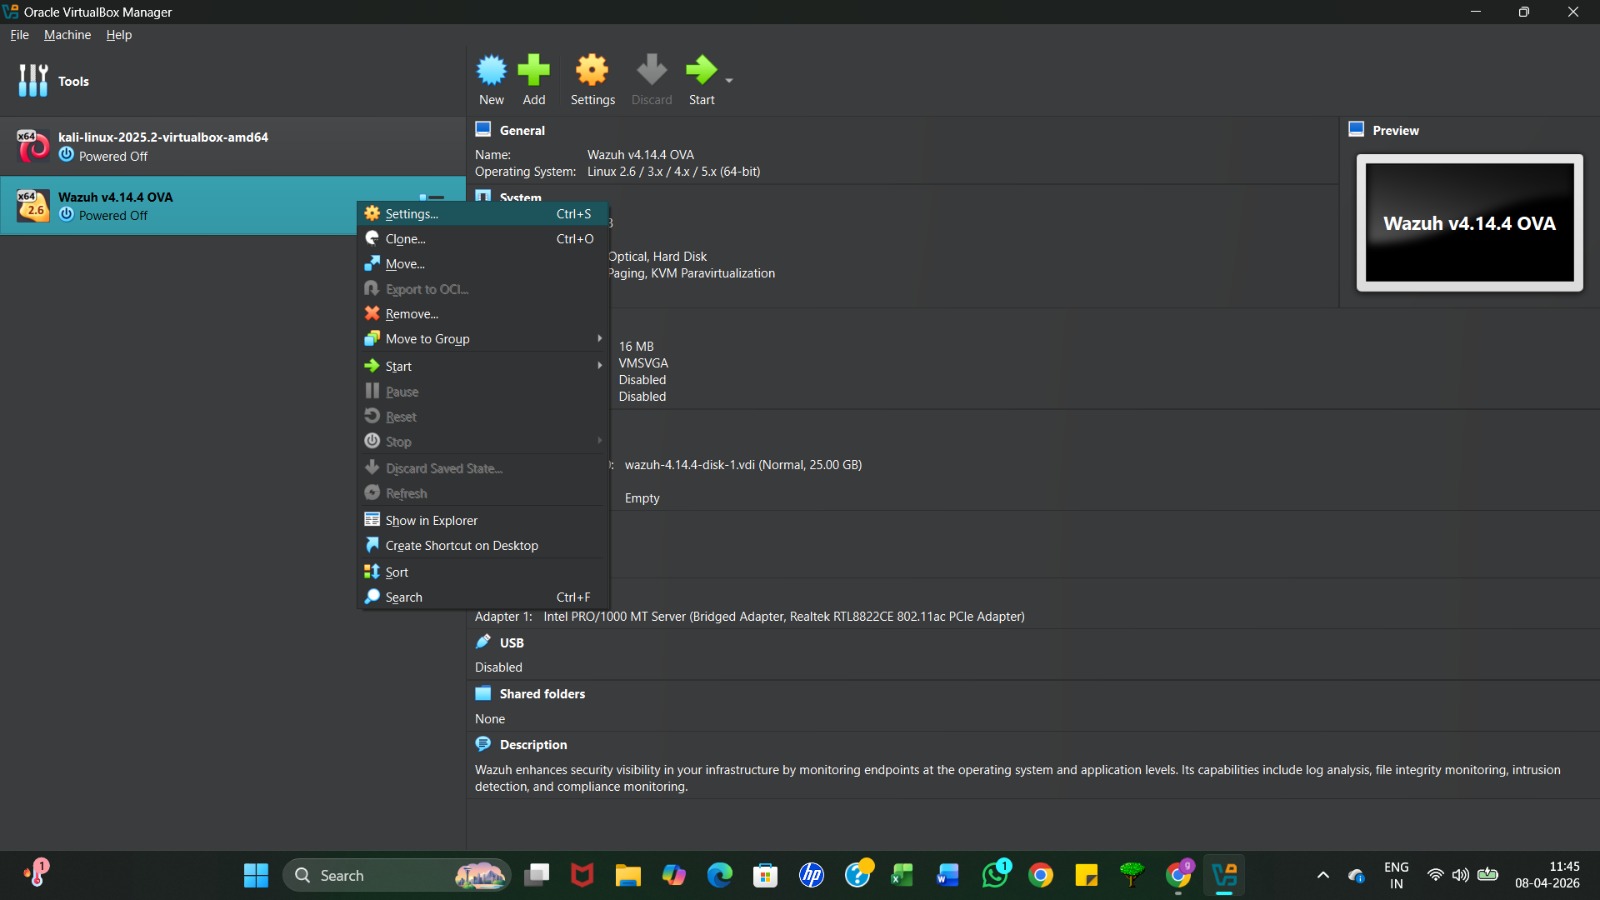
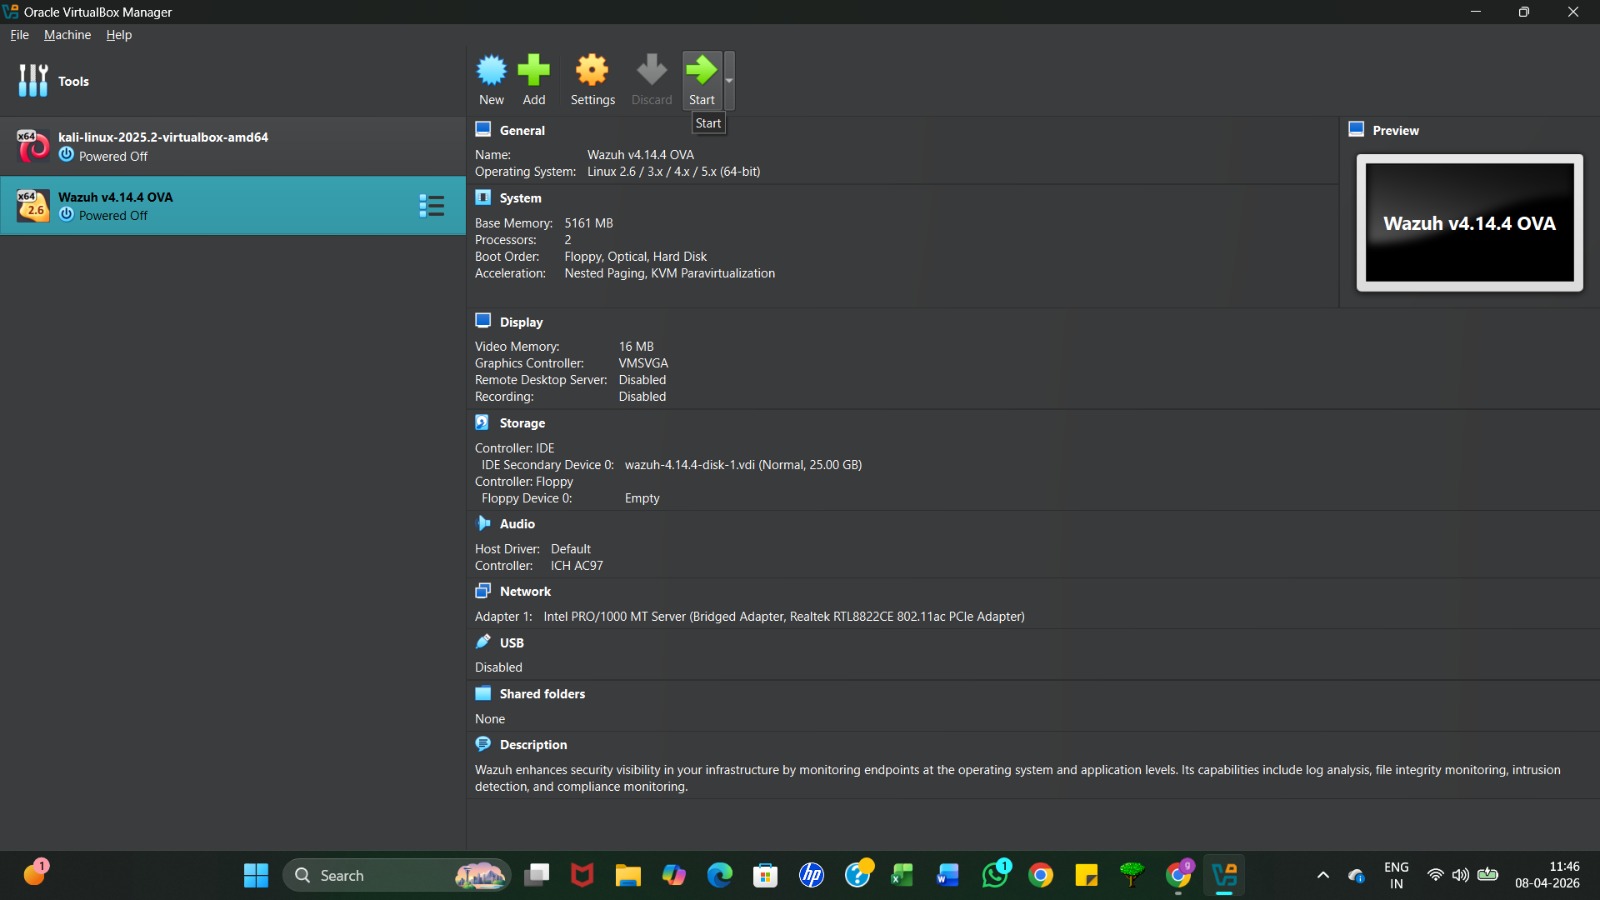
Right-click on the imported Wazuh OVA and select Settings to verify the virtual hardware configuration before booting
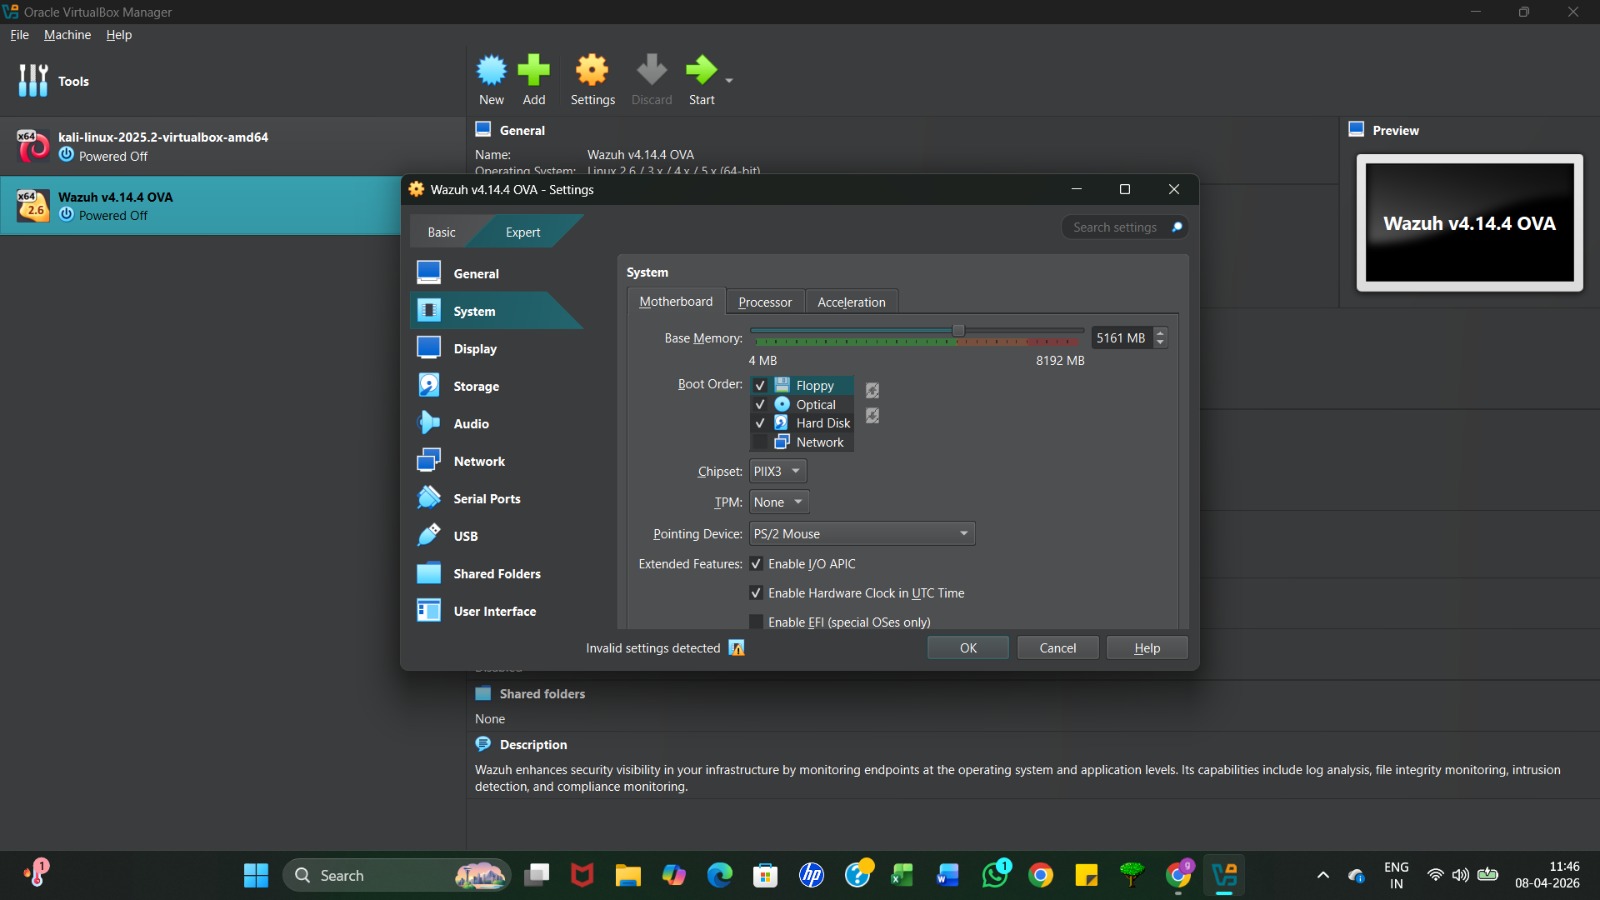
Under the System tab , ensure the Base Memory is set correctly (typically 4GB–8GB) and check that the Hard Disk is first in the boot order
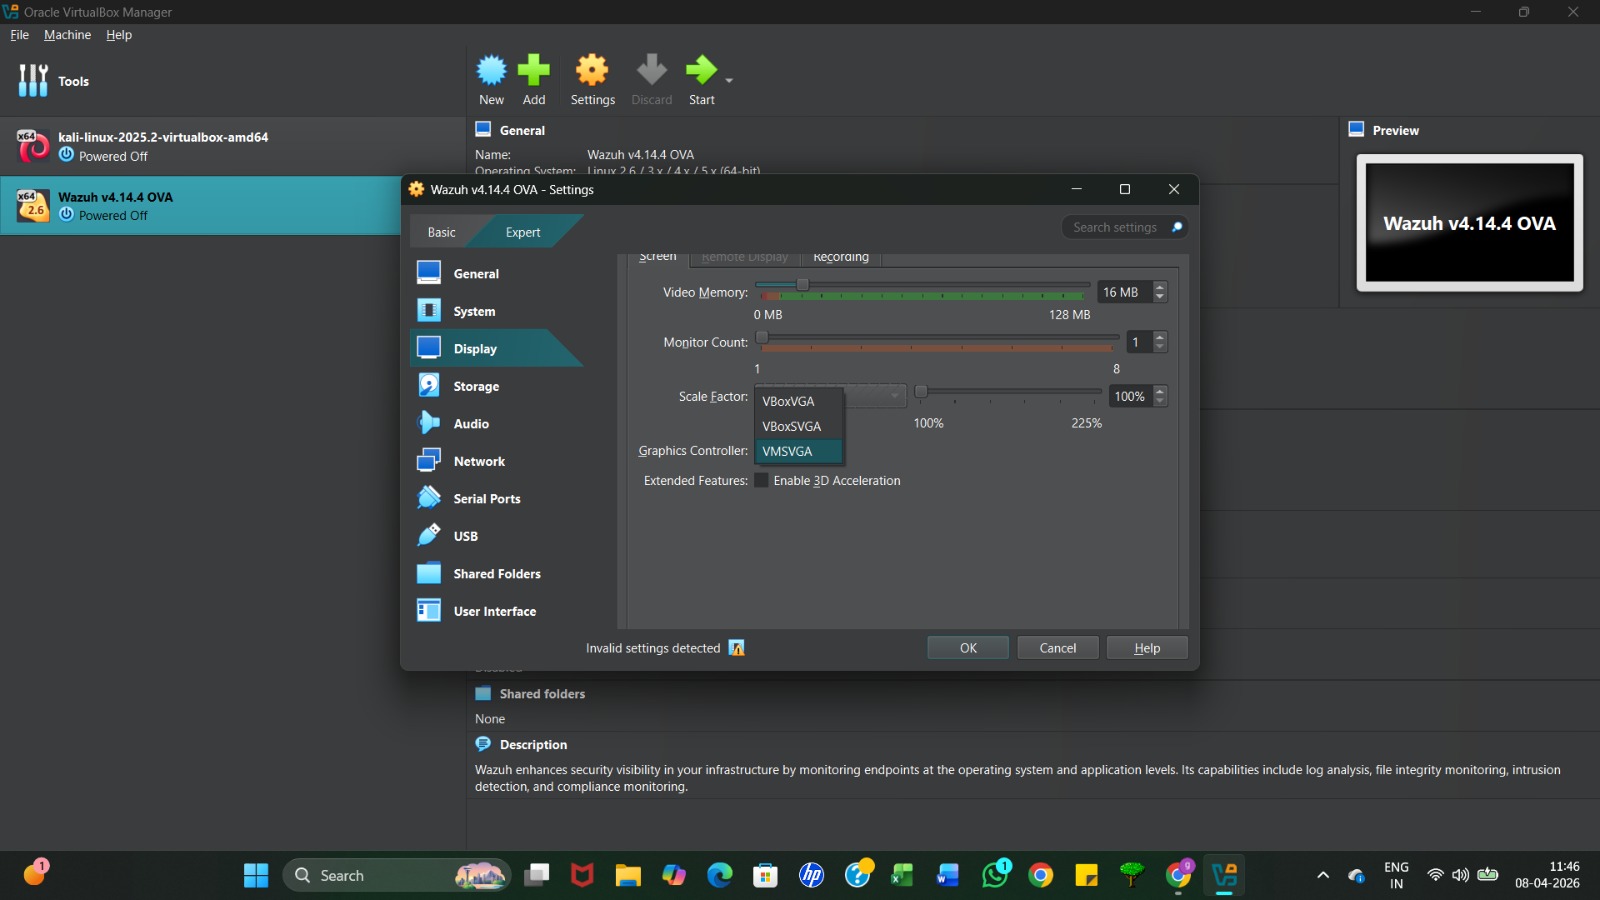
In the Display tab, verify the Graphics Controller is set (VMSVGA is usually recommended) to ensure the terminal window renders correctly.
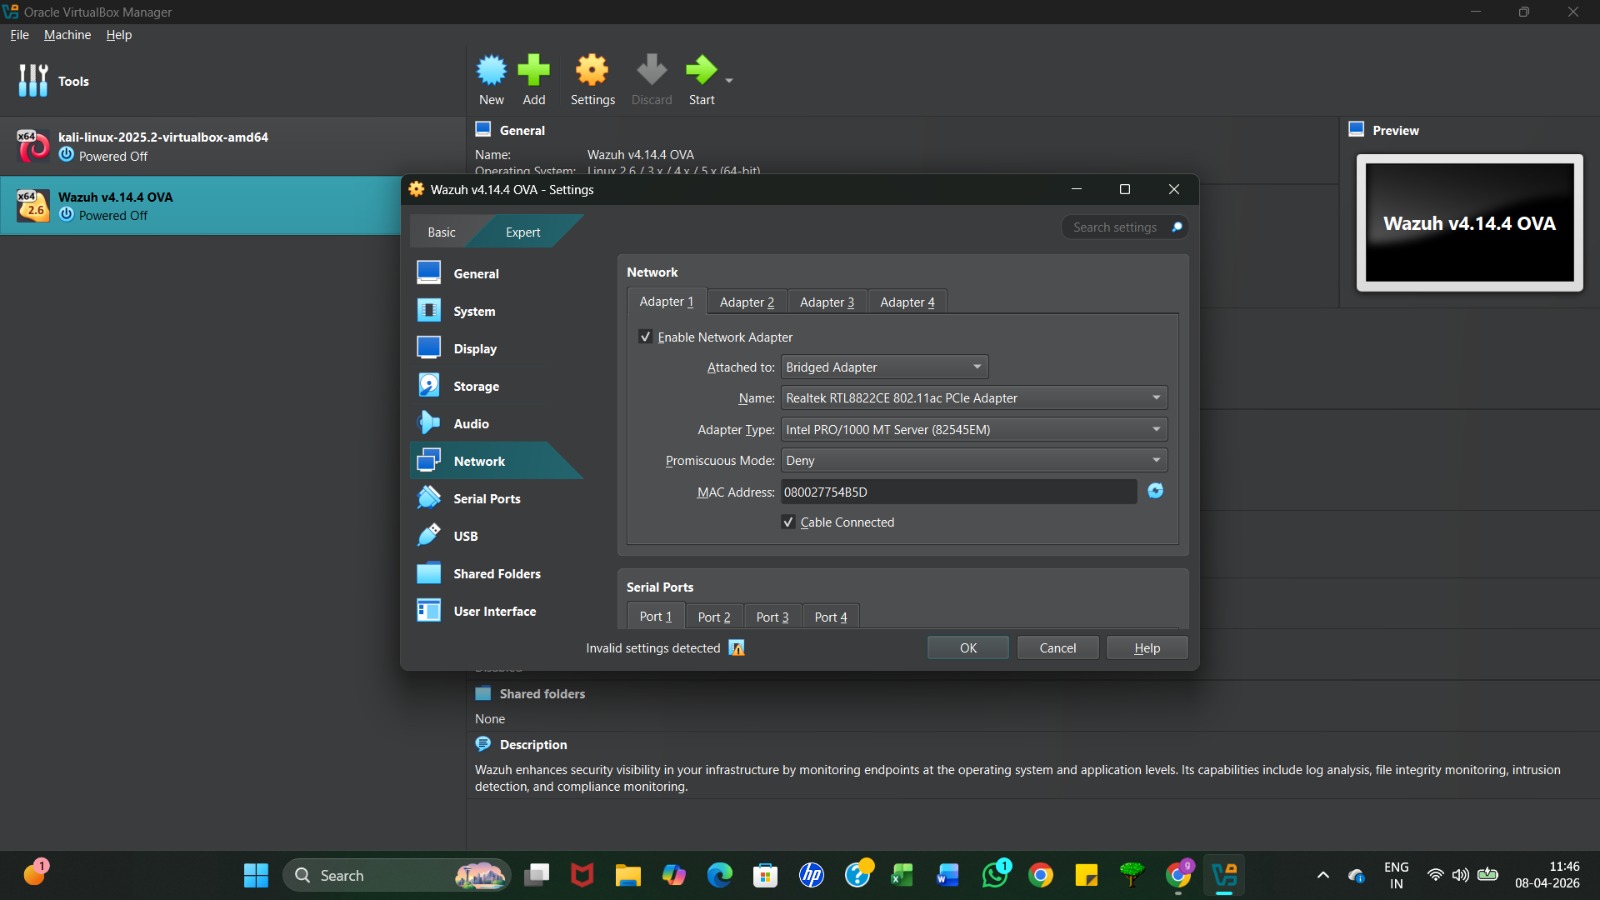
In the Network tab, change "Attached to" to Bridged Adapter. This allows the Wazuh server to receive its own IP address on your local network so other devices can connect to it
Once all settings are verified, click the green start and begin the Wazuh initialization. arrow to poweron the virtual machine
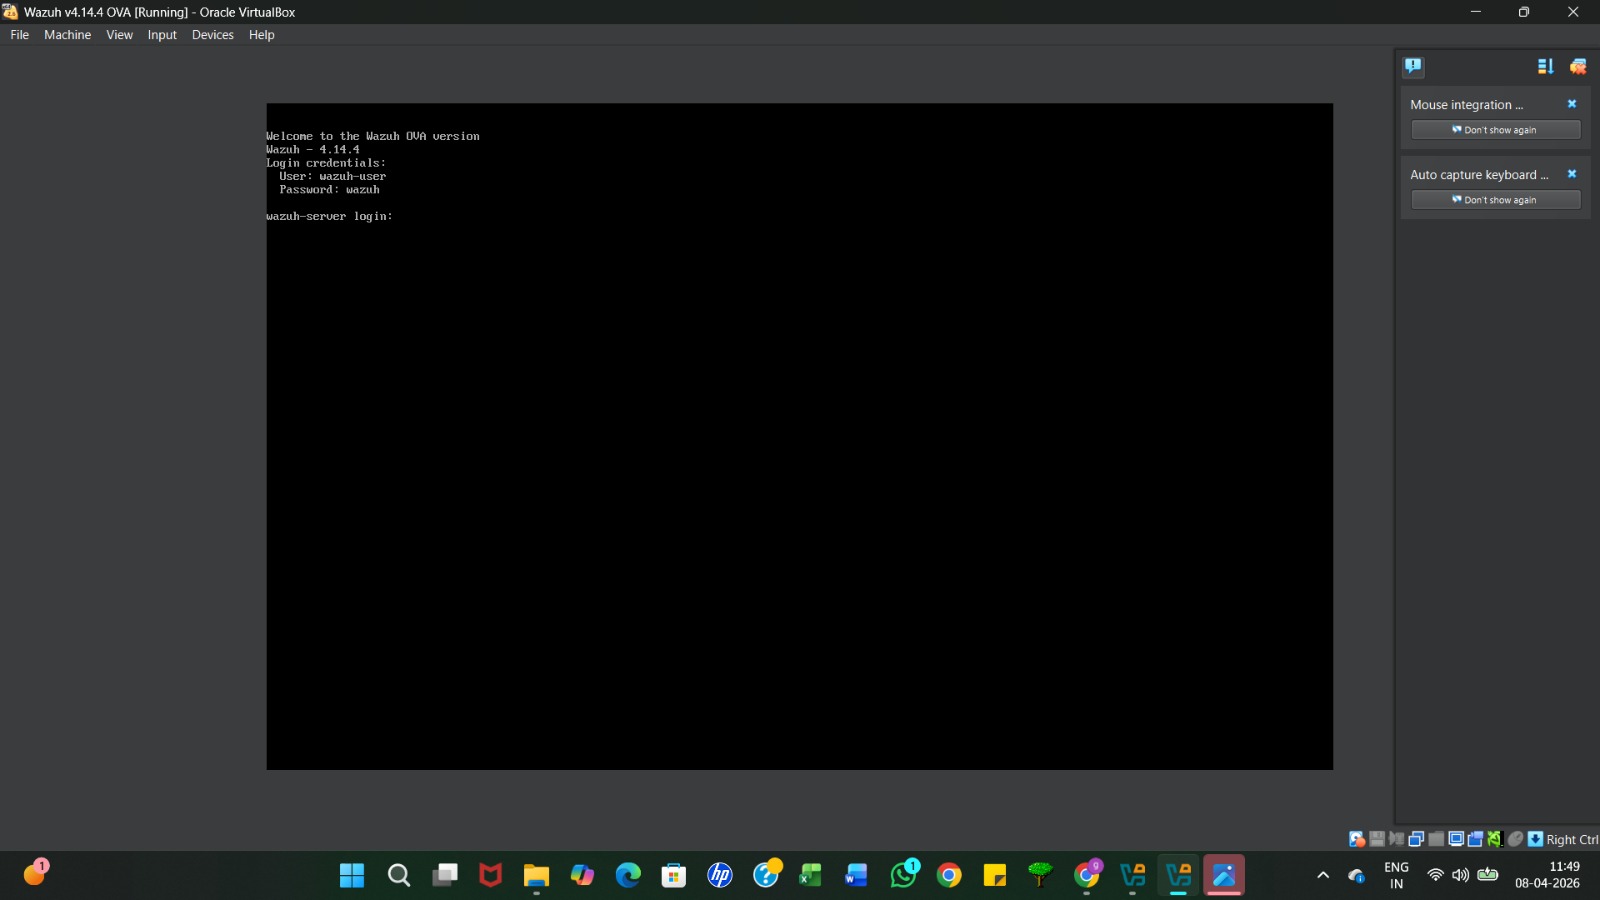
Once the VM boots, you will see the login prompt. Use the defaultcredentials provided on the screen: User: wazuh-user and Password: wazuh.
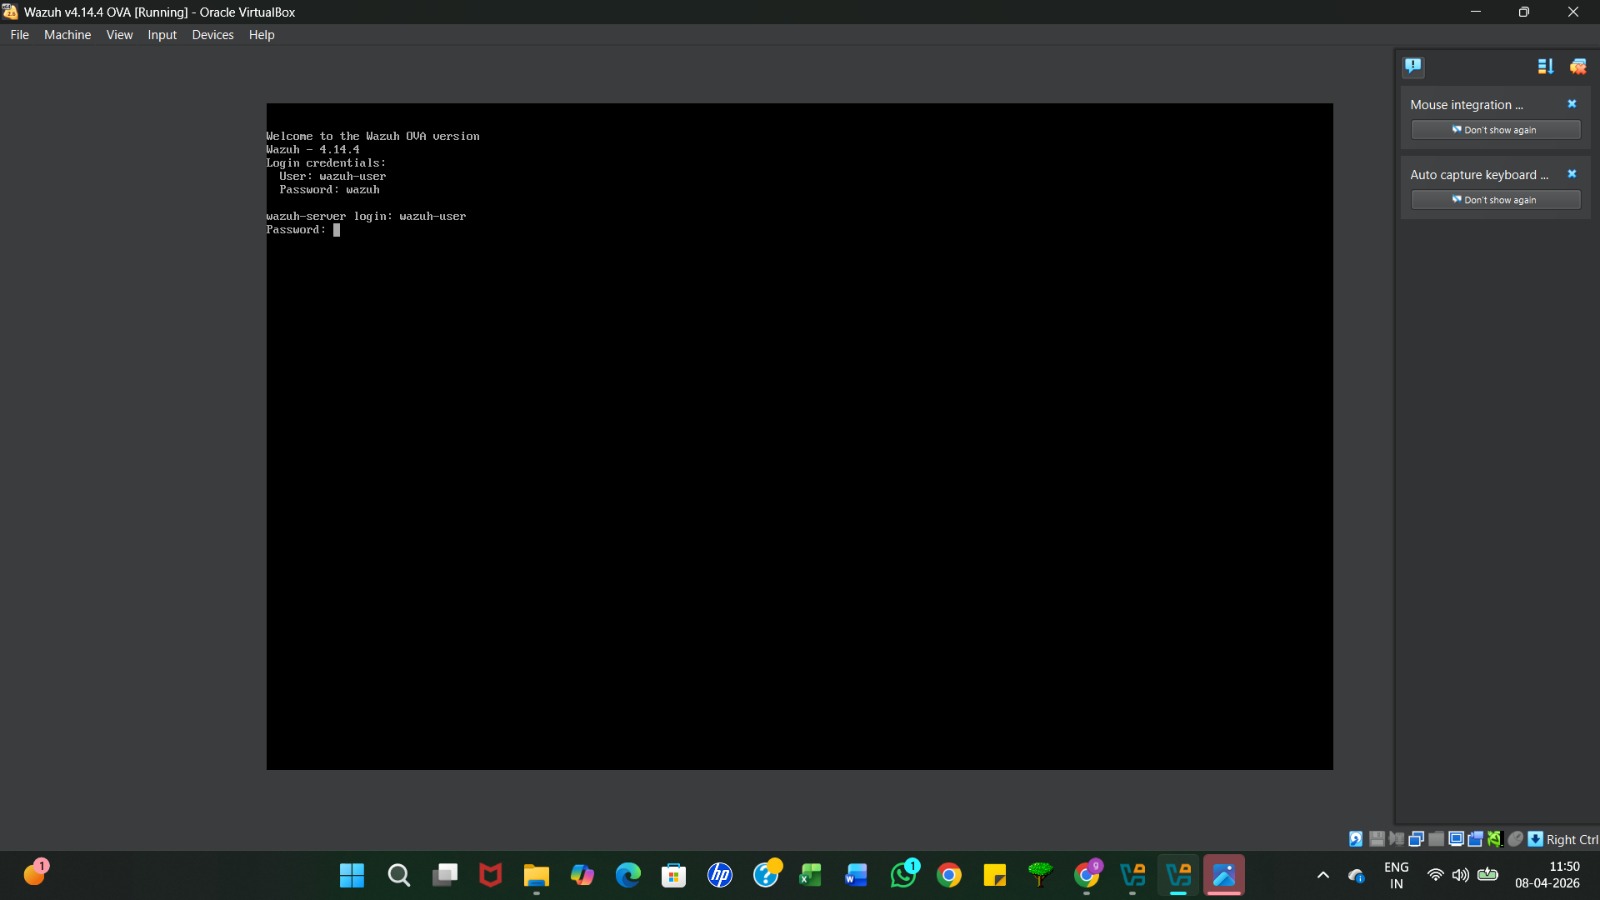
Type the username wazuh-user and press Enter, then type the password wazuh . Note that the characters will not appear on the screen as you type the password.
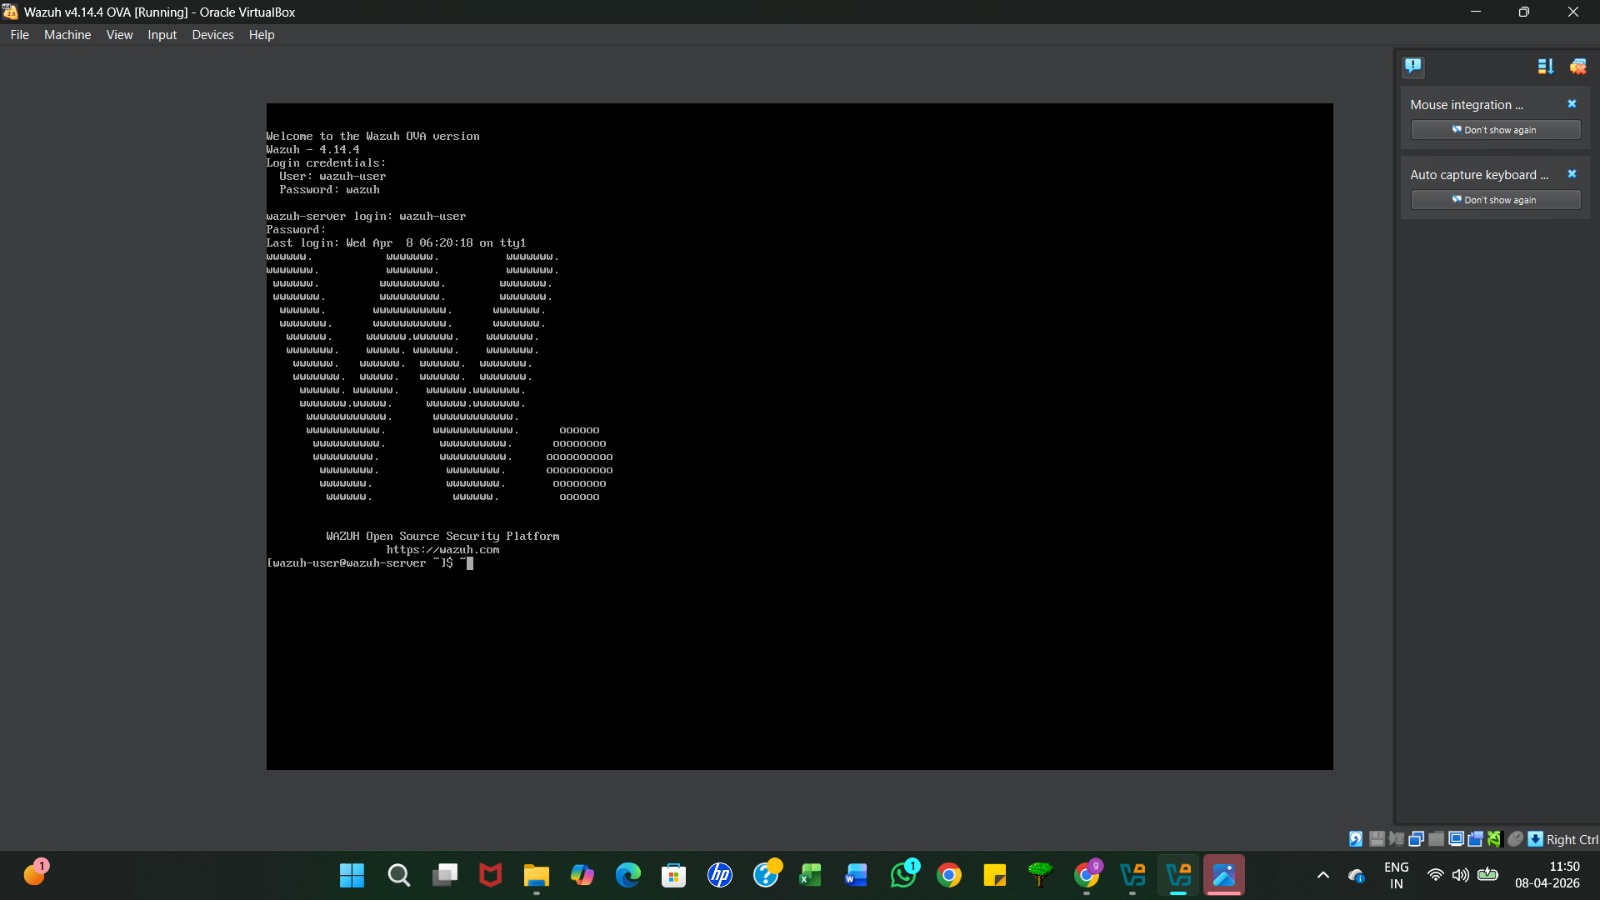
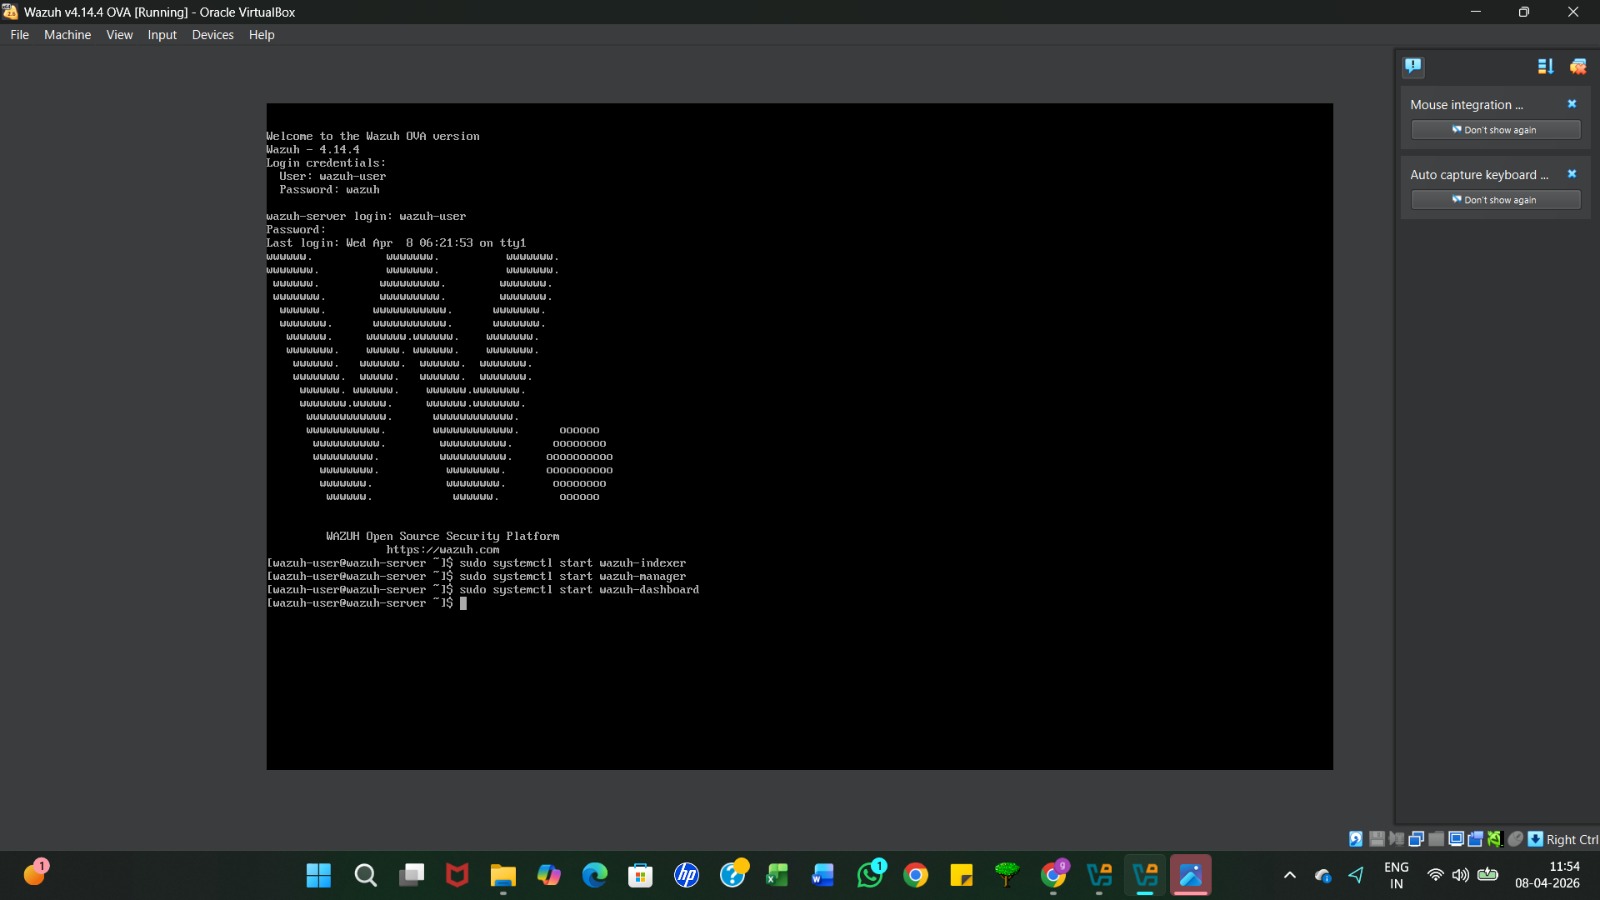
After logging in, you will see the Wazuh ASCII art logo and a command prompt, indicating the server is ready for commands.
Use the command sudo systemctl start [service-name] to manually start the Wazuh indexer, manager, and dashboard services.
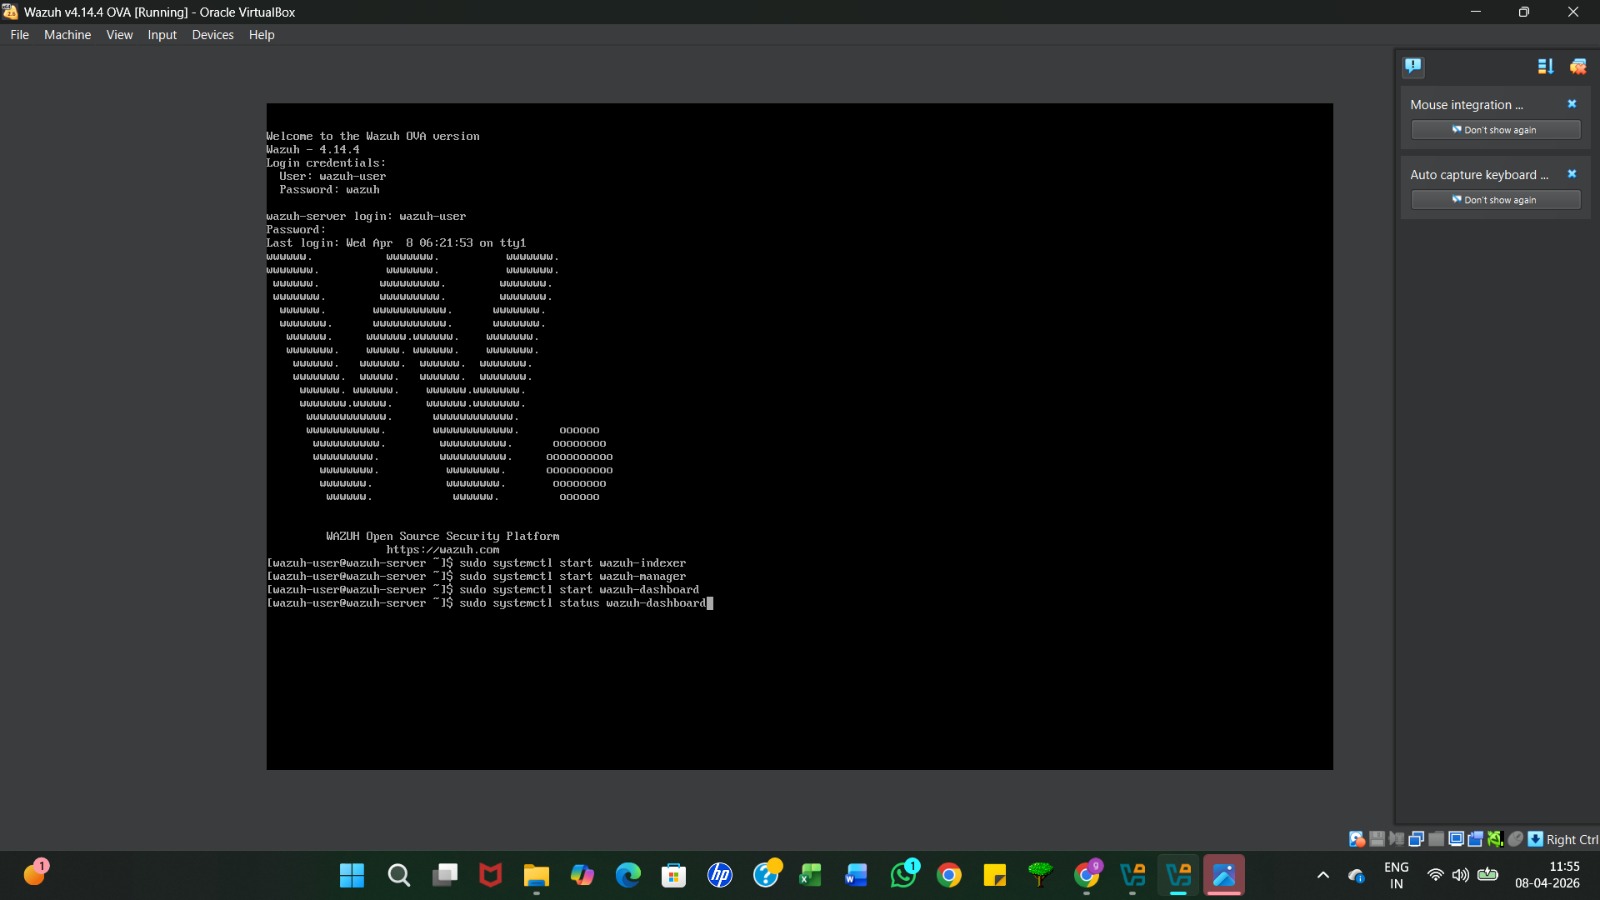
Run the command sudo systemctlstatus wazuh-dashboard to verify if the web interface service is active and running.
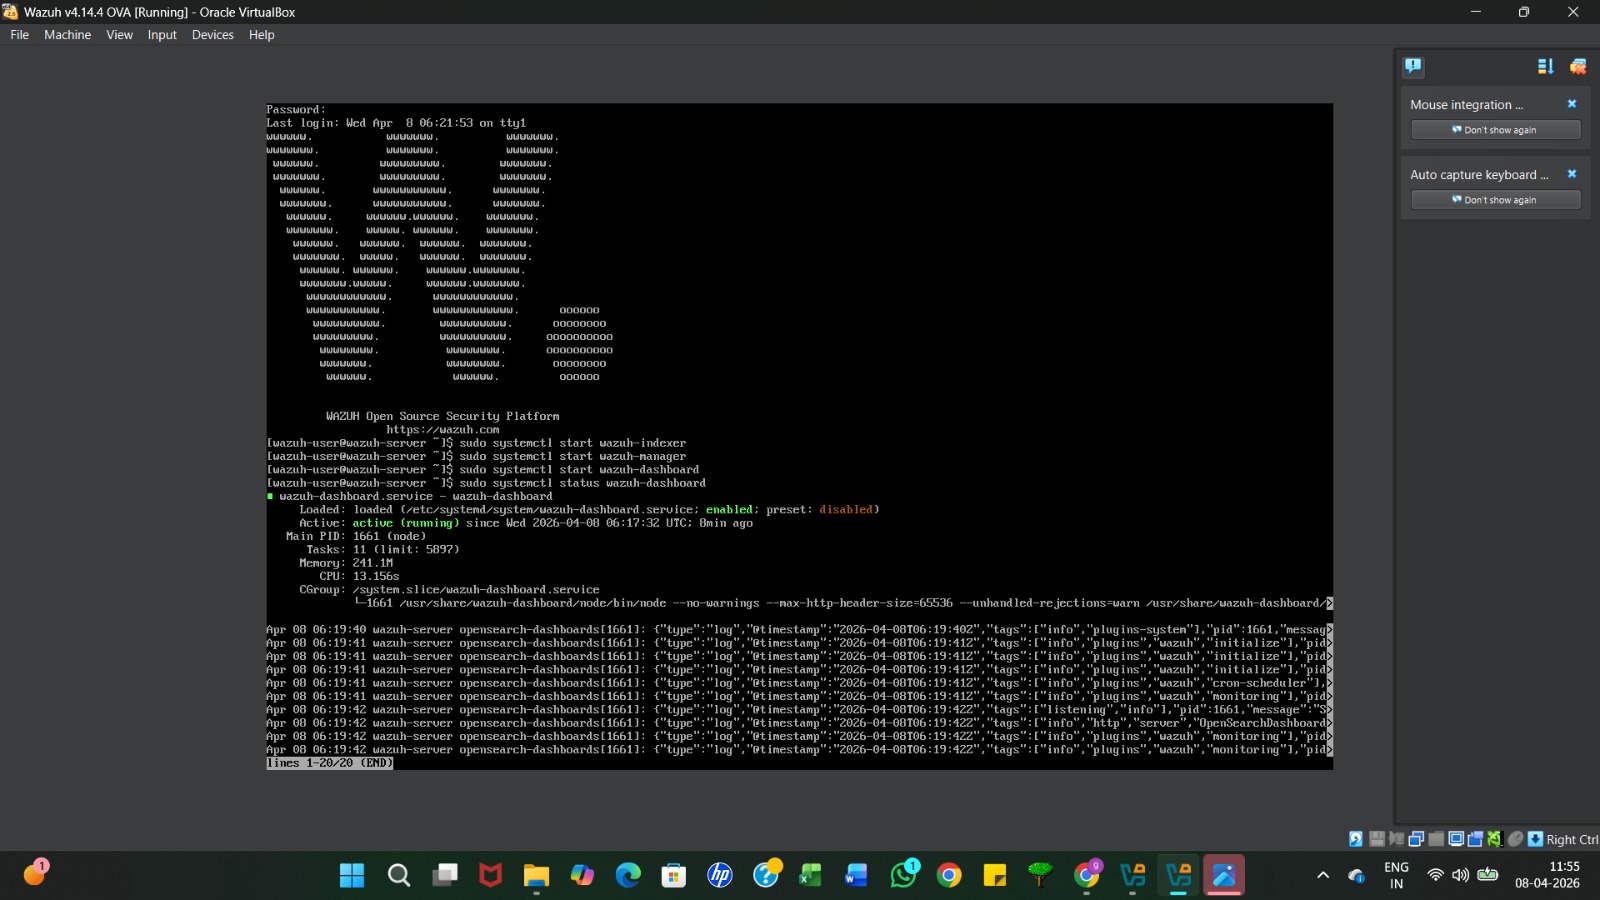
The terminal will display "active (running)" in green text, confirmingthat the Wazuh dashboard is successfully functioning
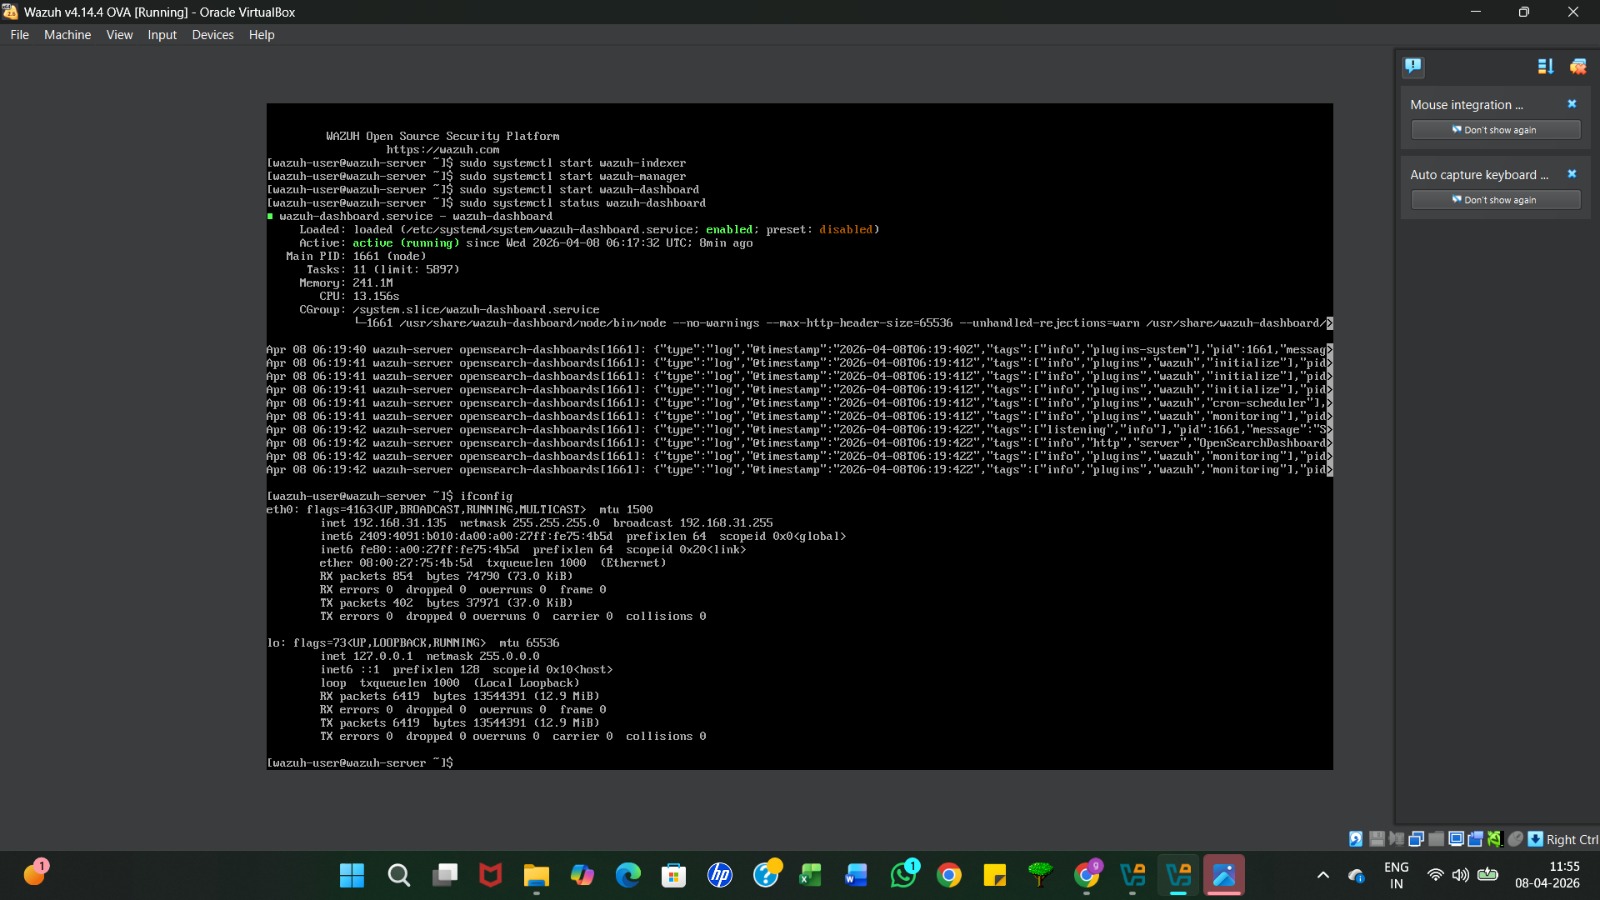
Run the ifconfig command to find the server's IP address. Look for the inet value under eth0 (e.g., 192.168.31.135), which you will use to access the dashboard from your browser.
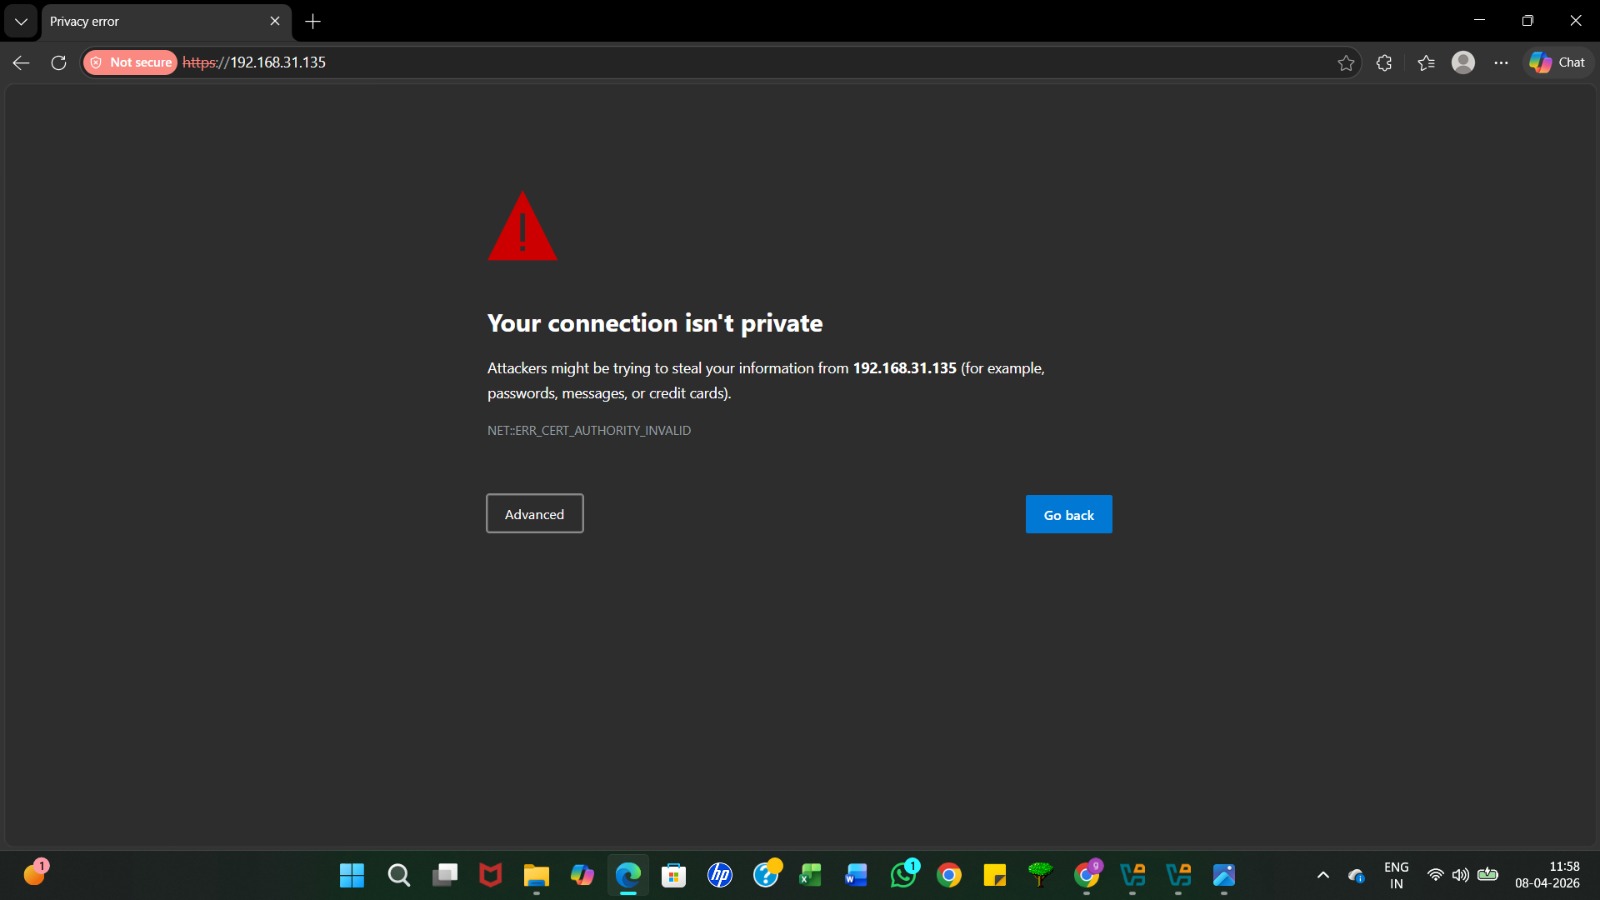
Open your web browser and type https:// followed by your server's IP address (e.g., https://192.168.31.135) into the address bar.
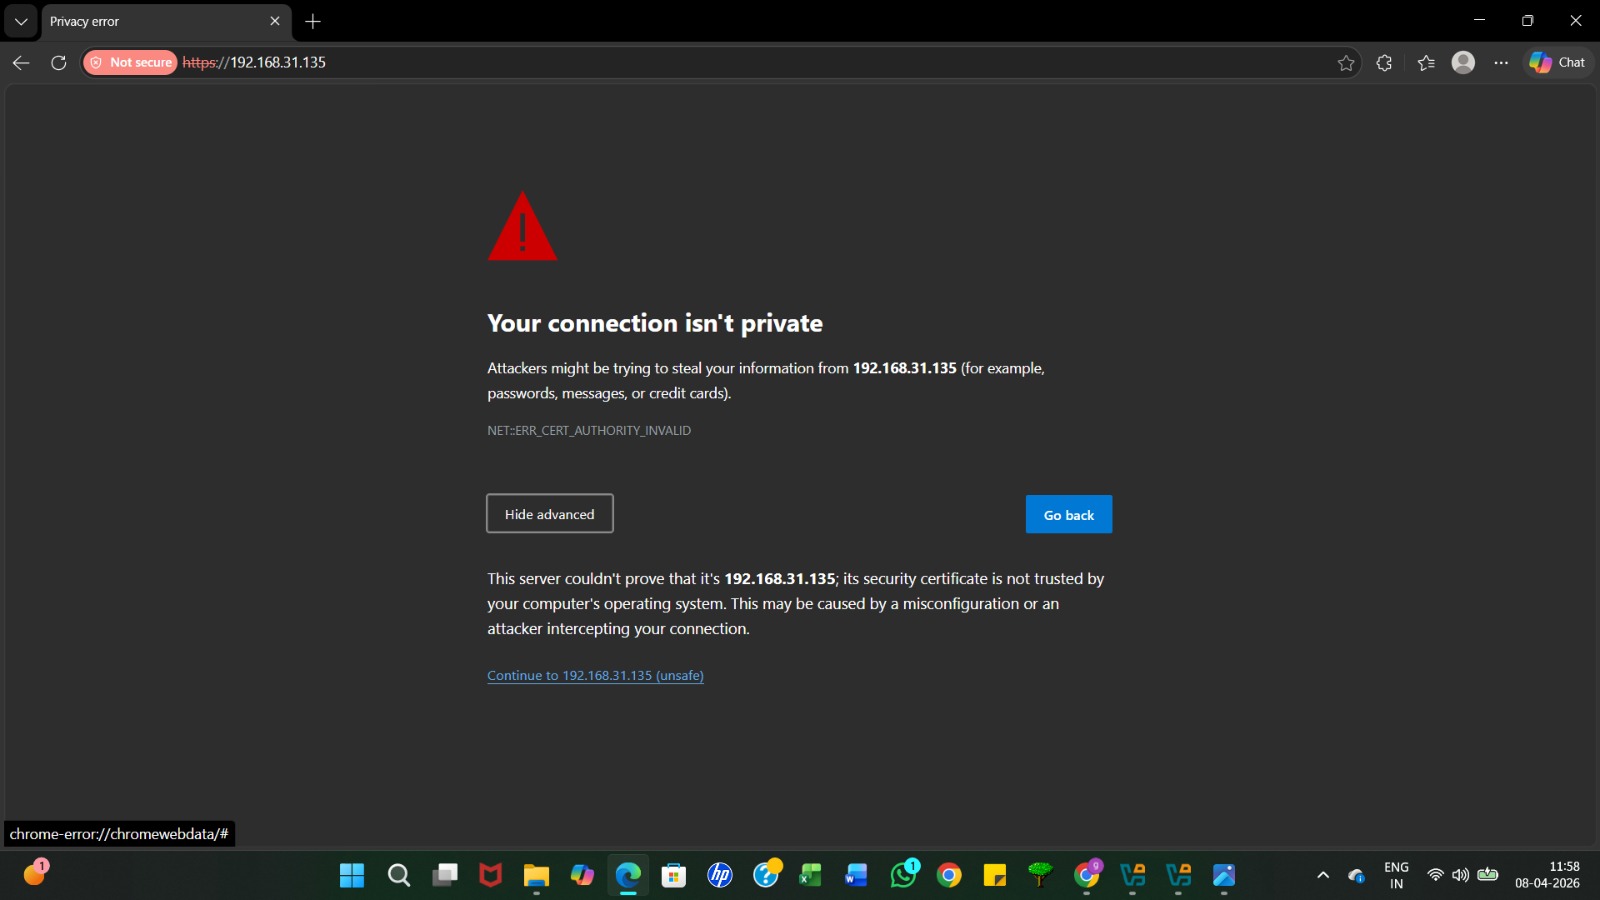
Because the server uses a self-signed certificate, click the Advanced button on the "Your connection isn't private" warning page.
Click the link that says "Continue to [IP Address] (unsafe)" to proceed to the Wazuh login portal.
You will be presented with the official Wazuh login screen; this is where you will enter your administrative credentials.
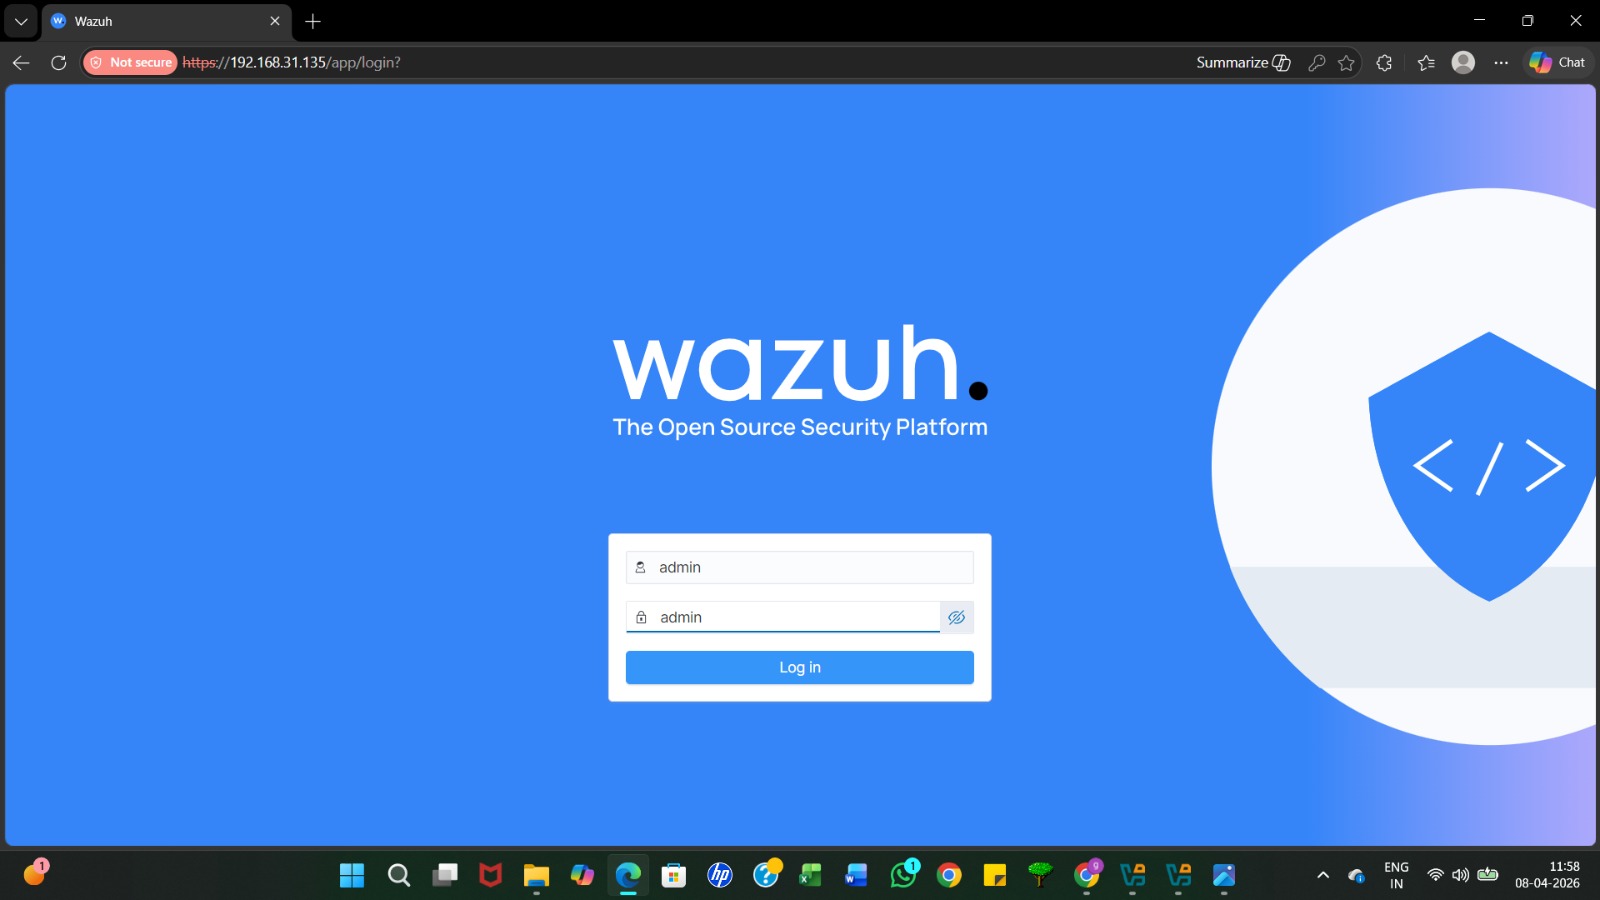
Enter the default web administrative credentials (typically Username: admin and Password: admin) and click Log in
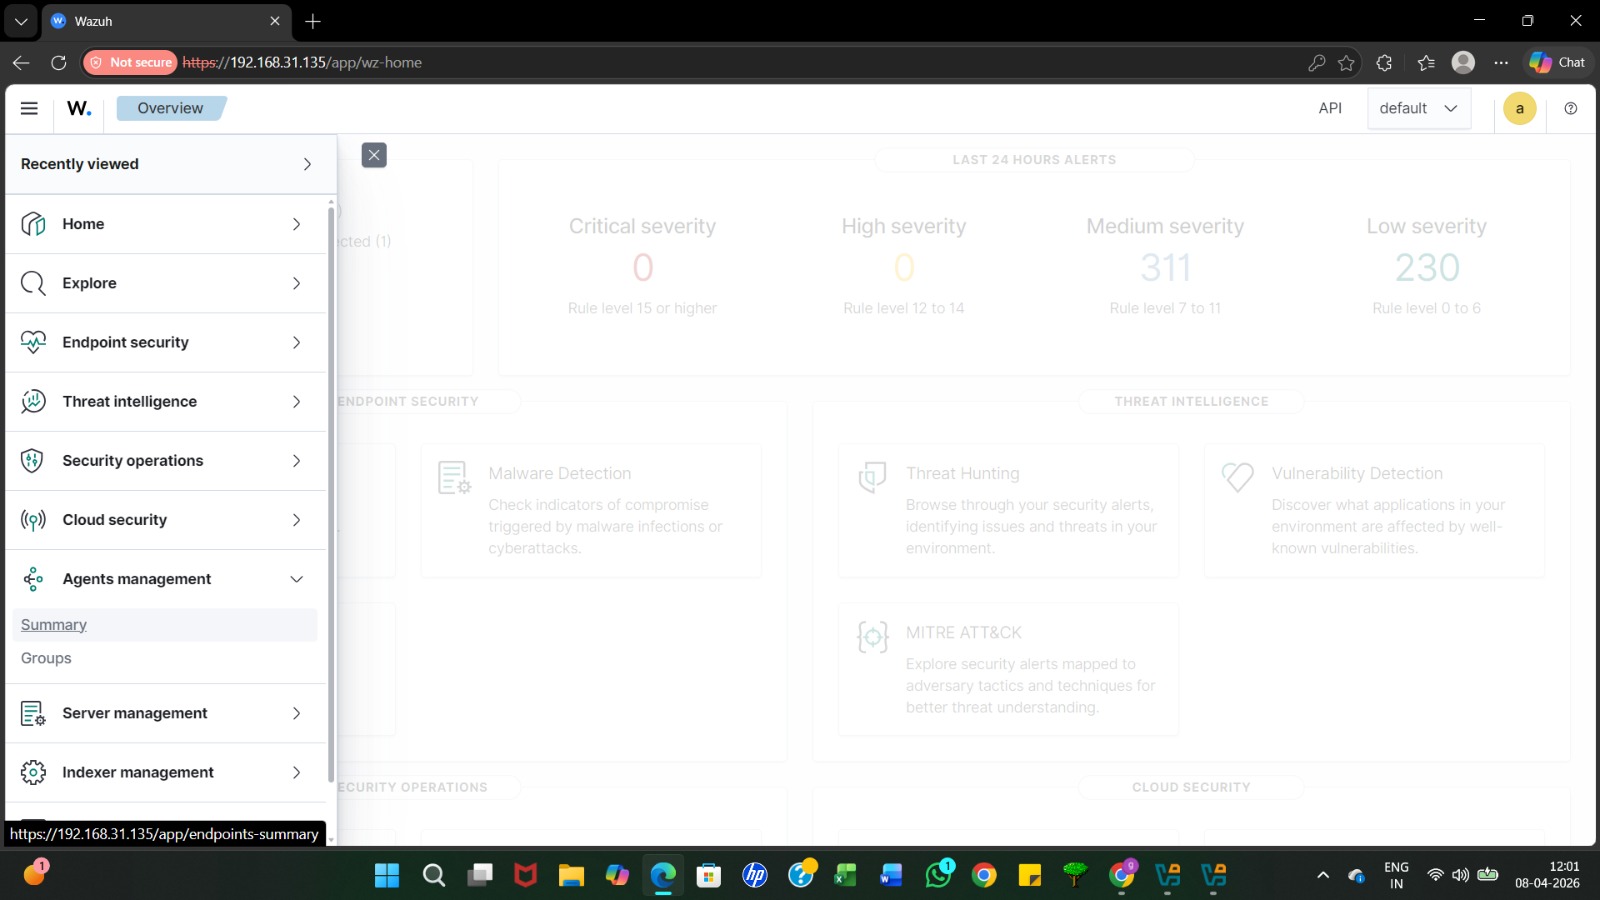
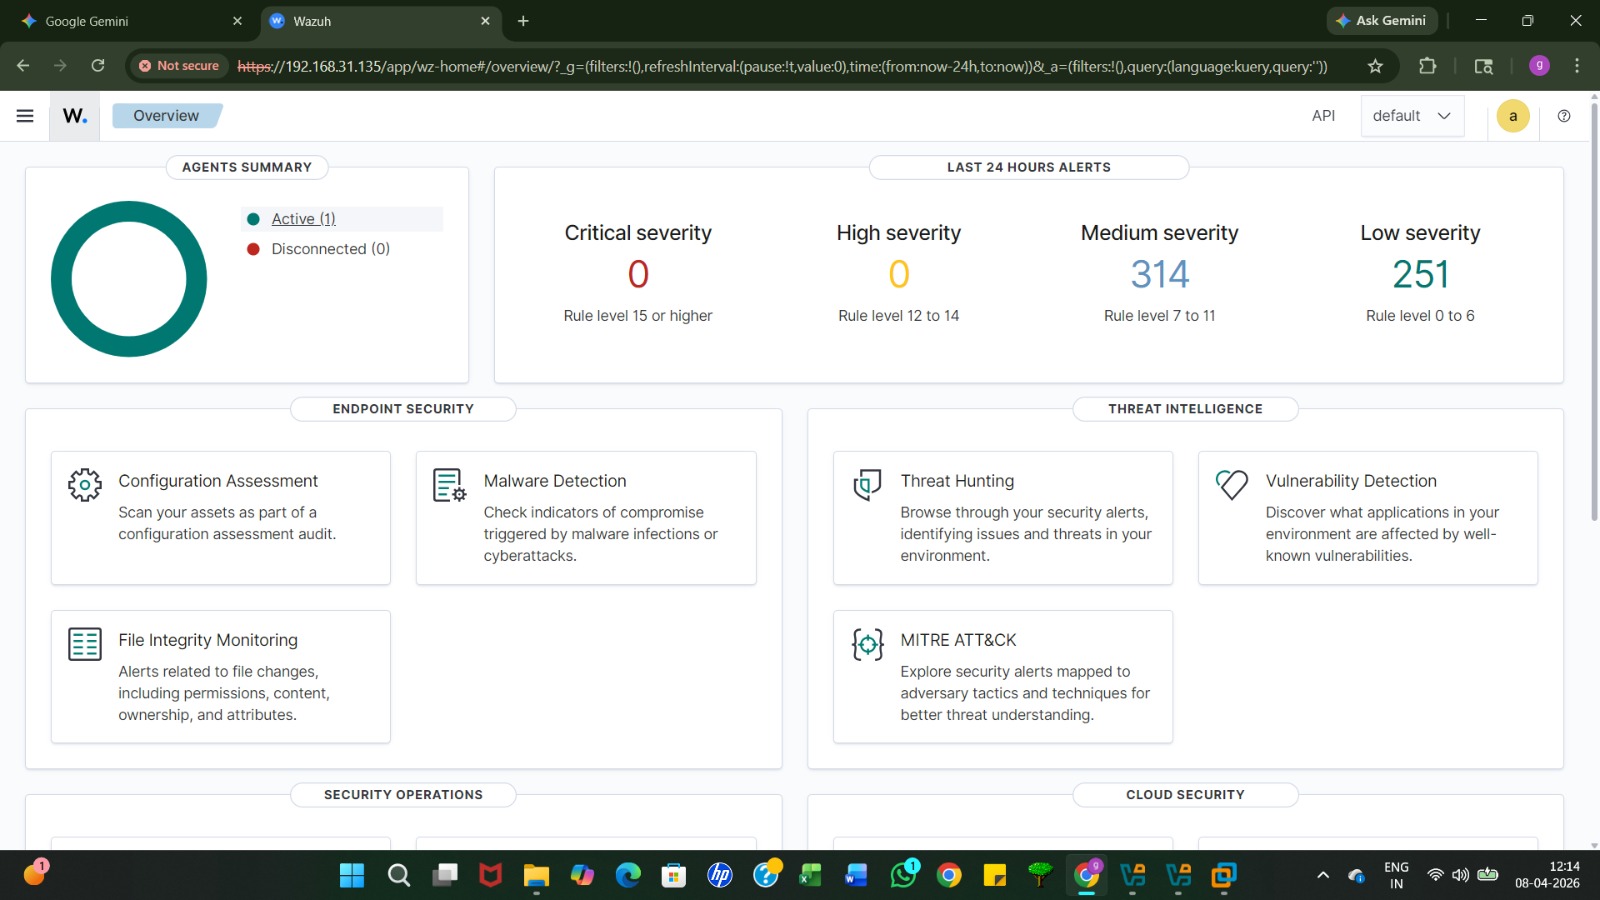
Once logged in, you will see the main Overview page, which displays a summary of agent status, alert severity levels, and security modules
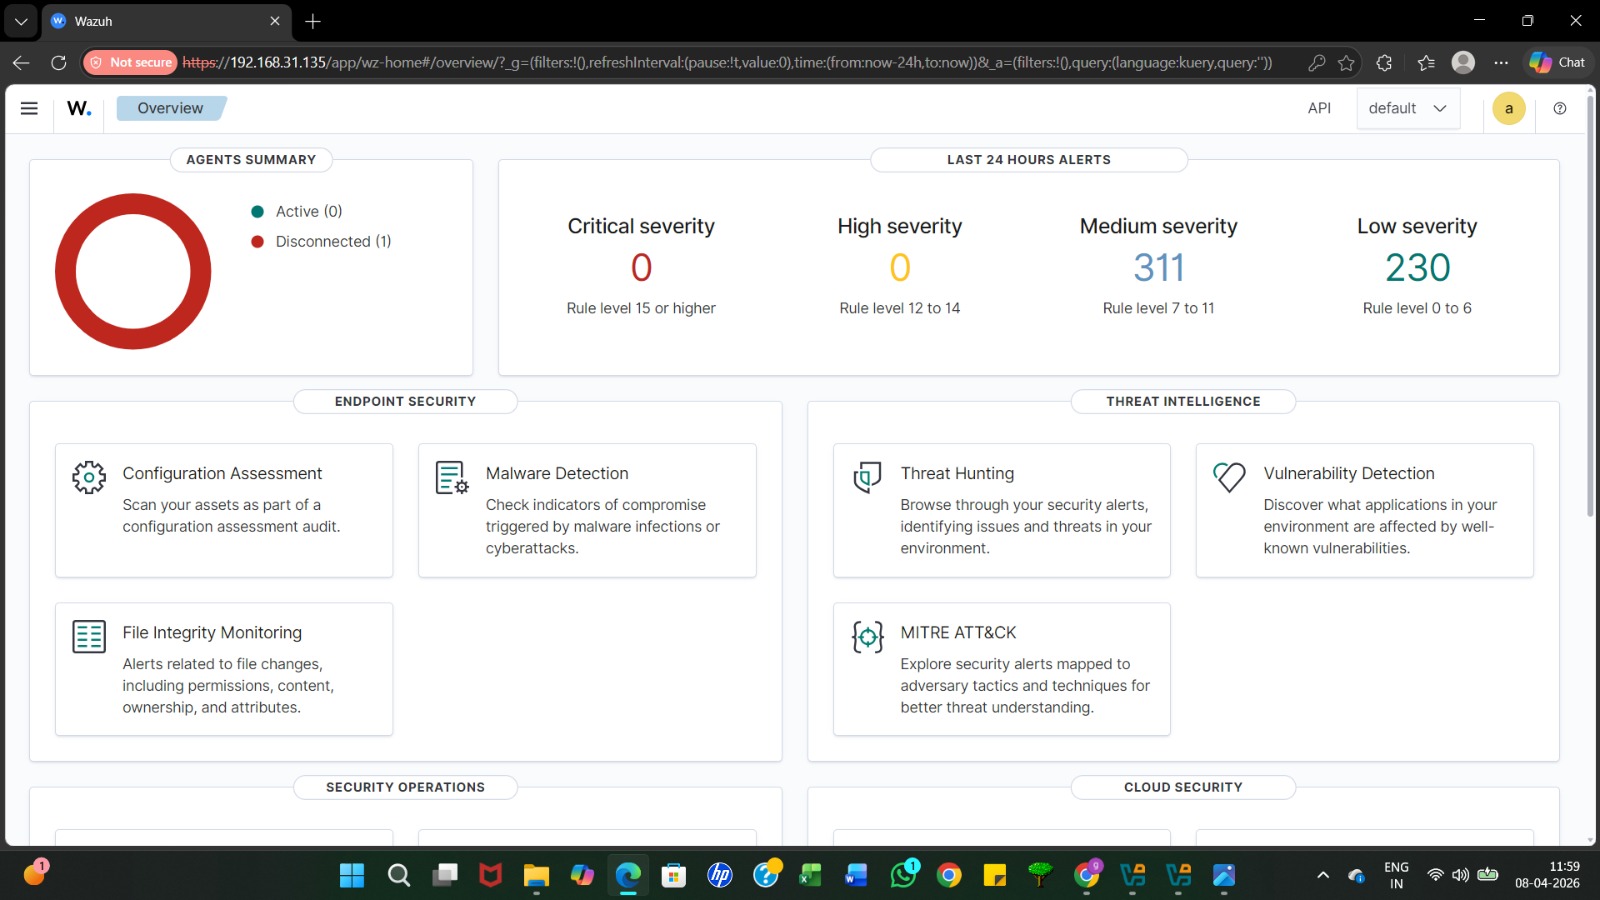
Click the menu icon (three horizontal lines) in the top-left corner to access specific modules like Endpoint Security, Threat Intelligence, and Agent Management.
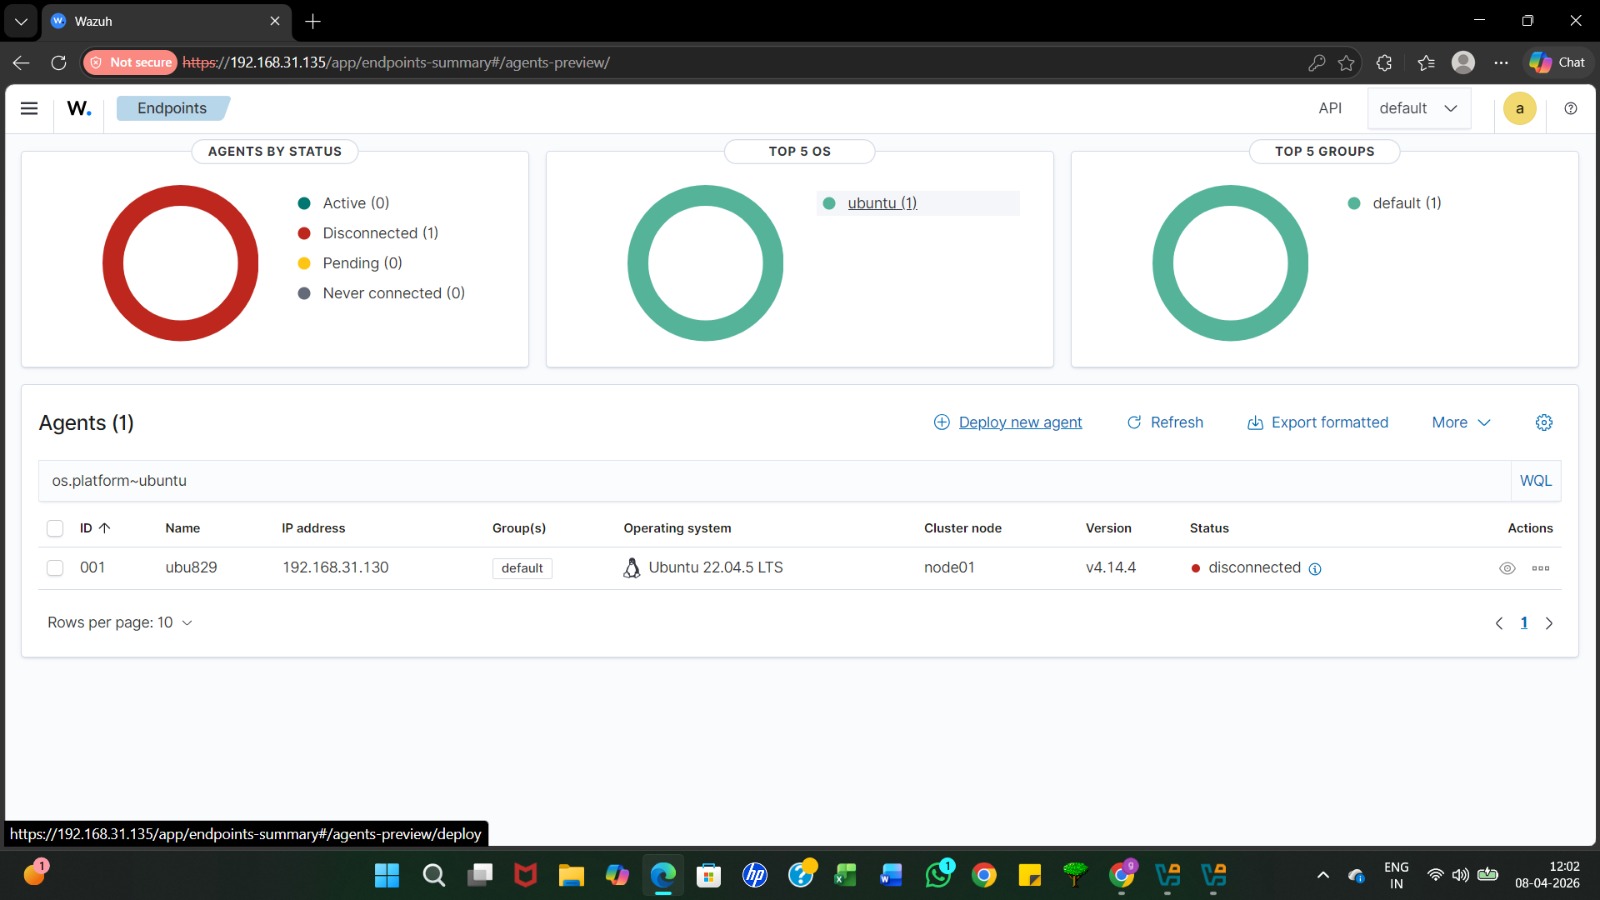
Navigate to the Agents section and click on Deploy new agent to start the process of adding a monitored device
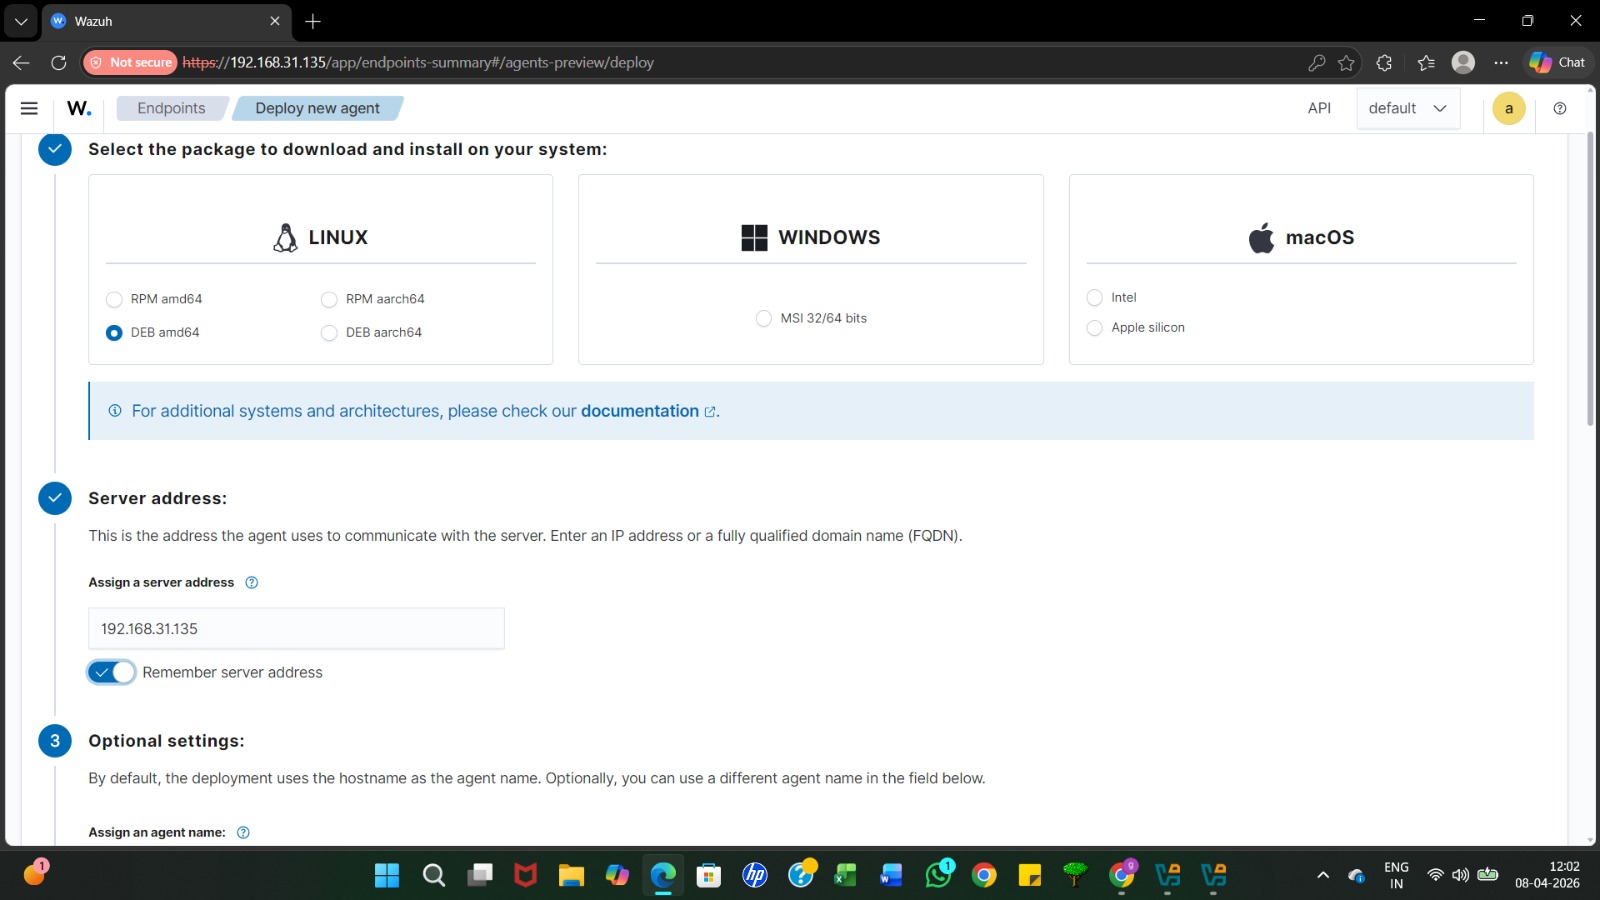
Choose the operating system for your agent (e.g. Linux DEB amd64 for Ubuntu) and enter the Wazuh server IP address to link the agent to the manager.
Provide a unique name for the agent (e.g.ubuntu04535) and selecta group (usually default) to organize your monitored endpoints.
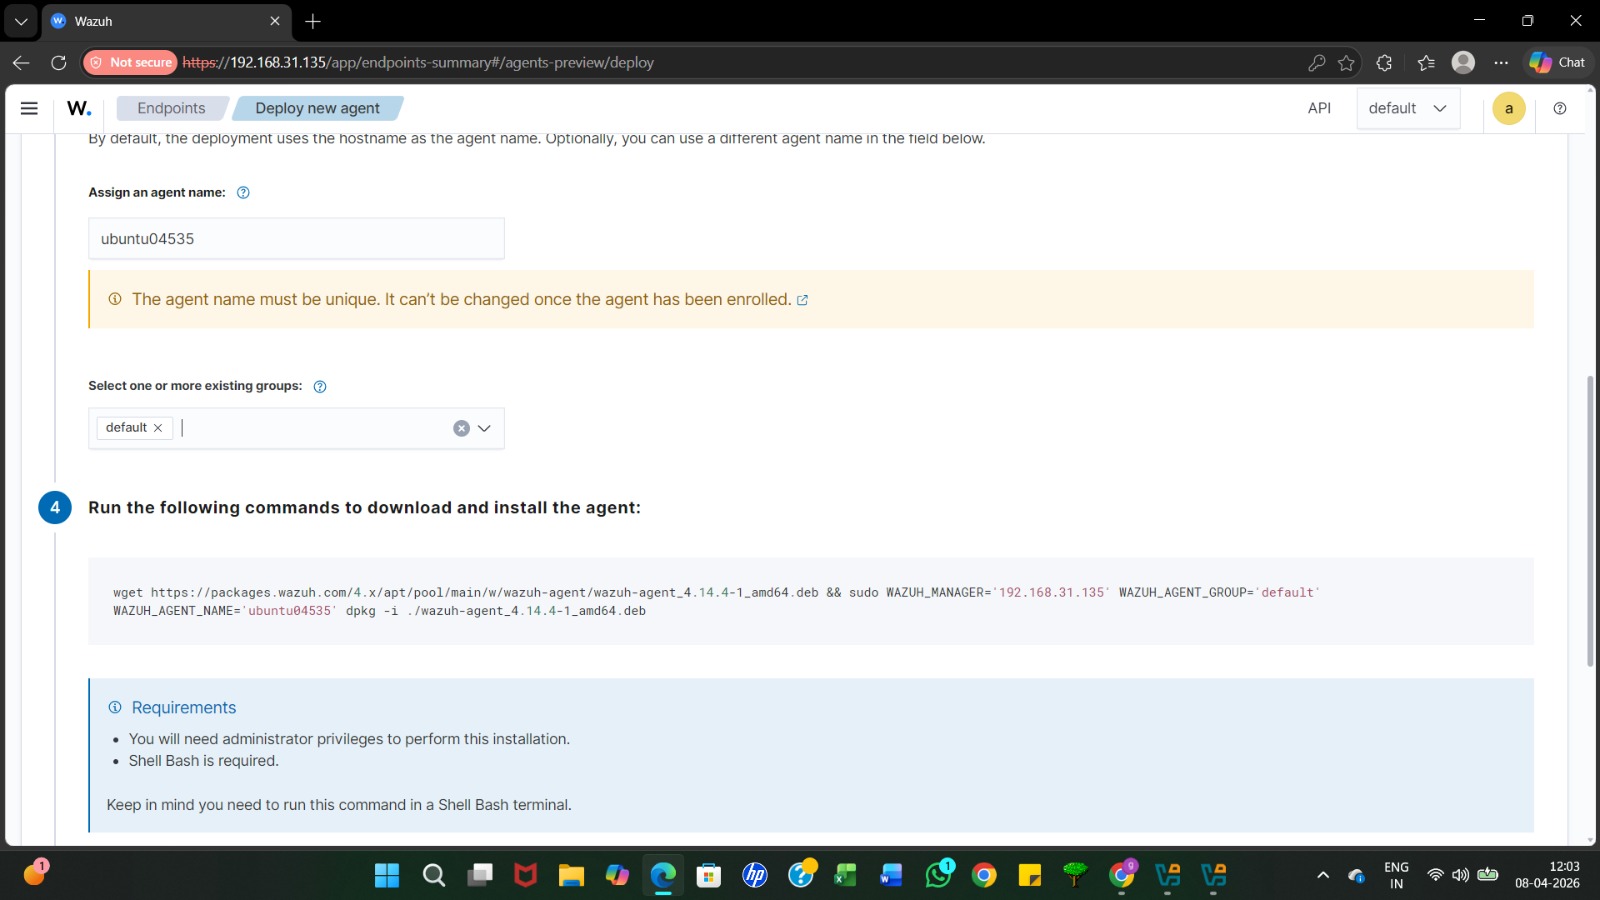
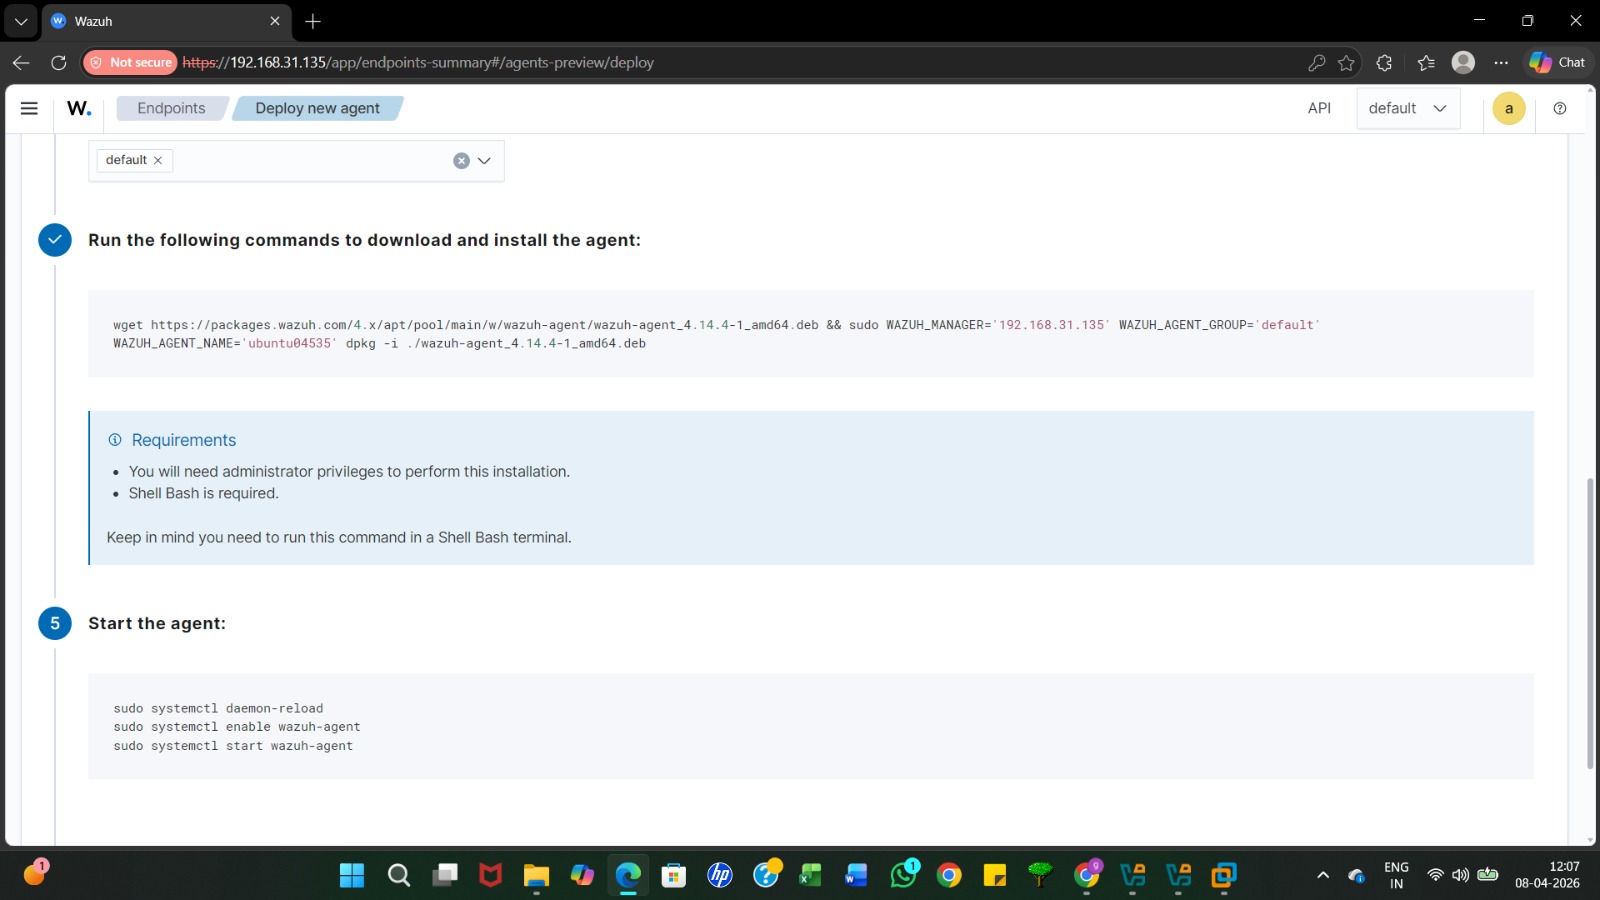
The dashboard automatically generates a wget command. Copythis entire string; it will download and install the Wazuh agent package on your target machine
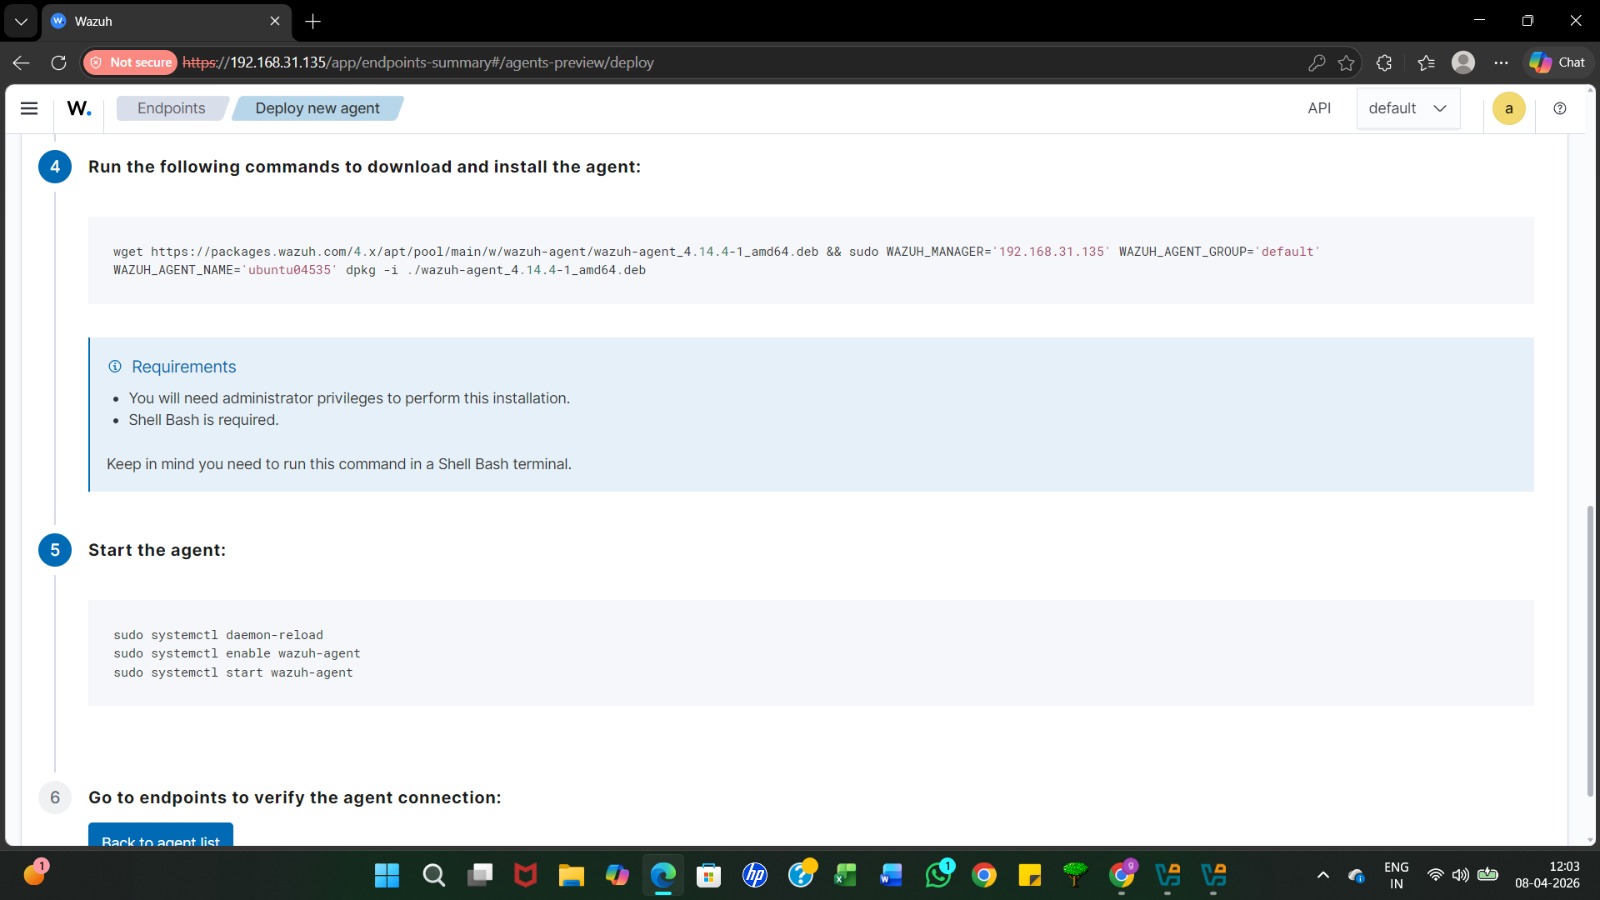
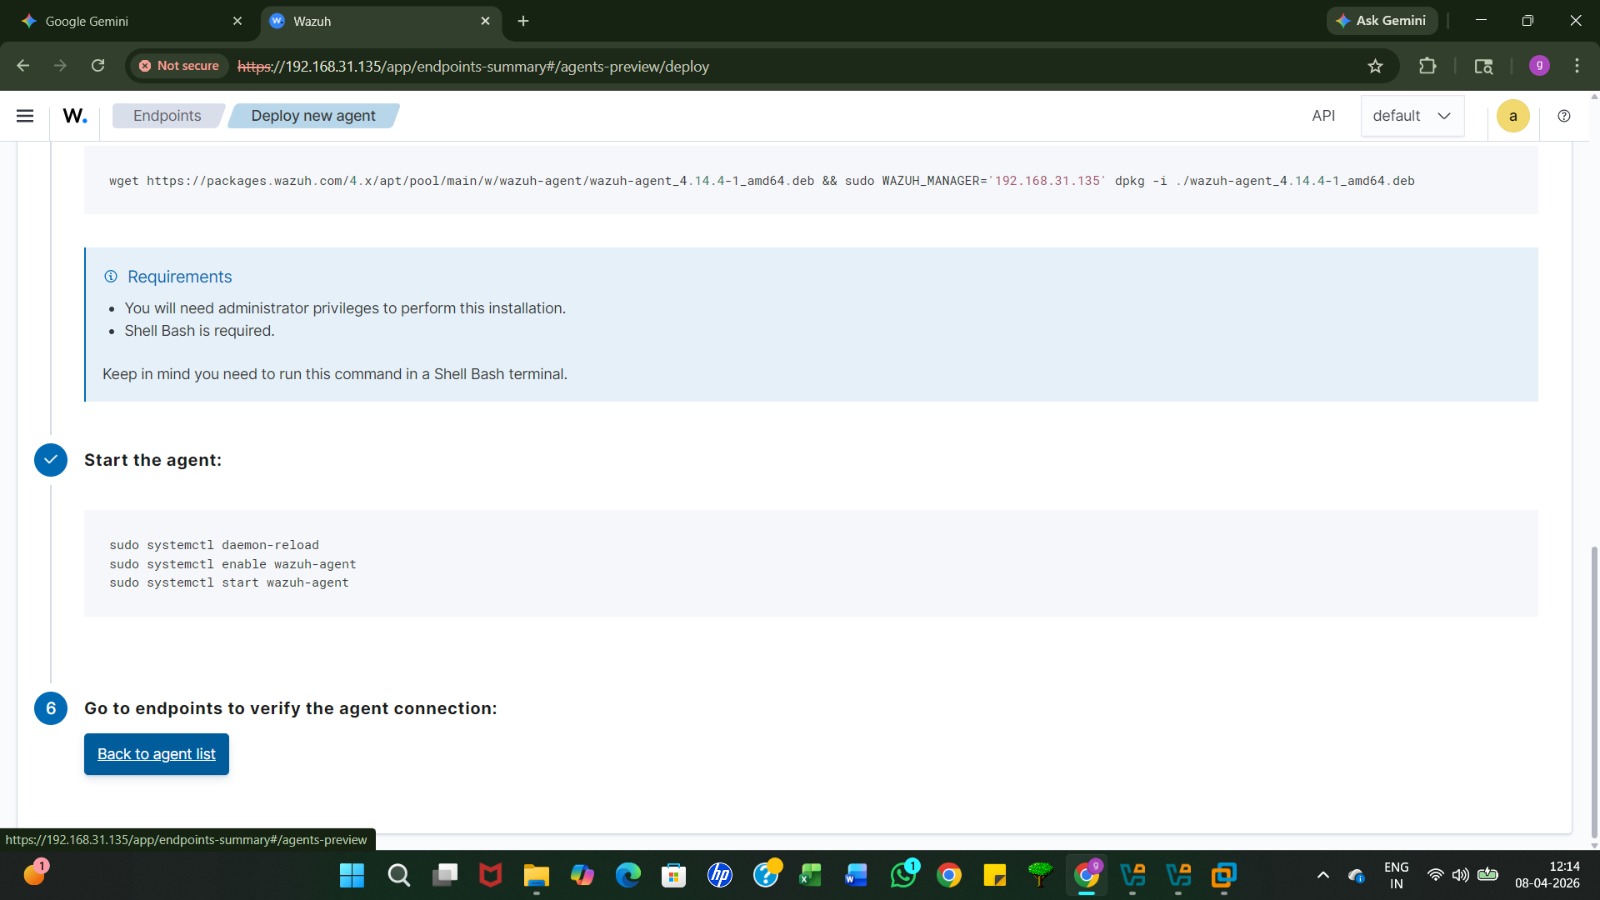
After installation, copy the commands provided in step 5 to reload the system daemon, enable the agent on boot, and start the service.
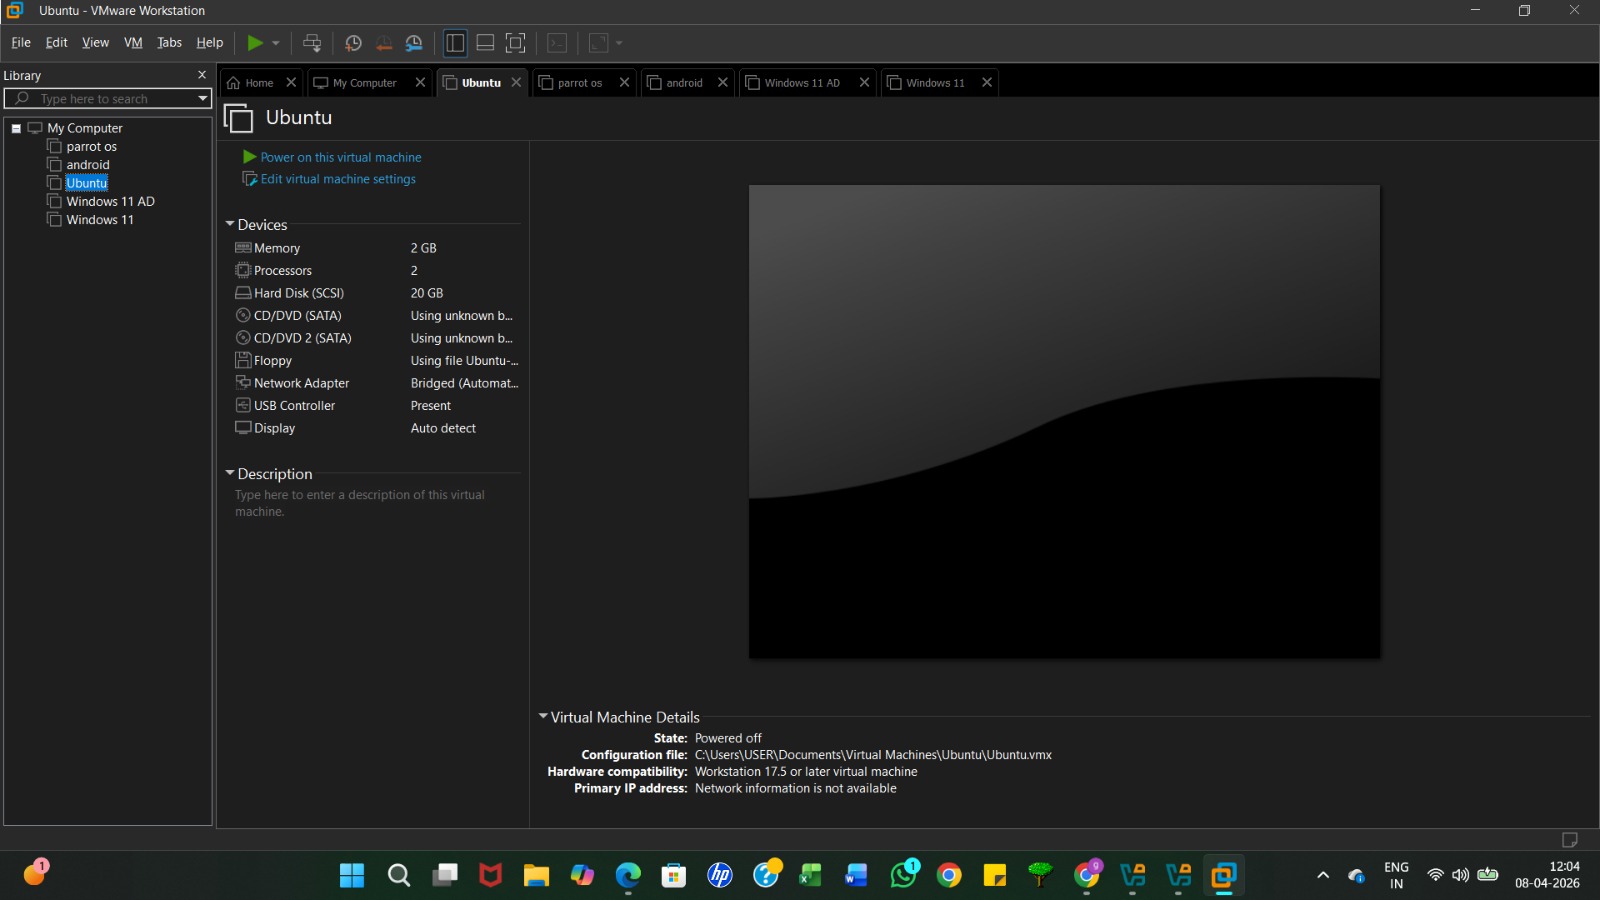
Open your target machine (e.g., Ubuntu) in VMware Workstationto prepare it for the agent installation.
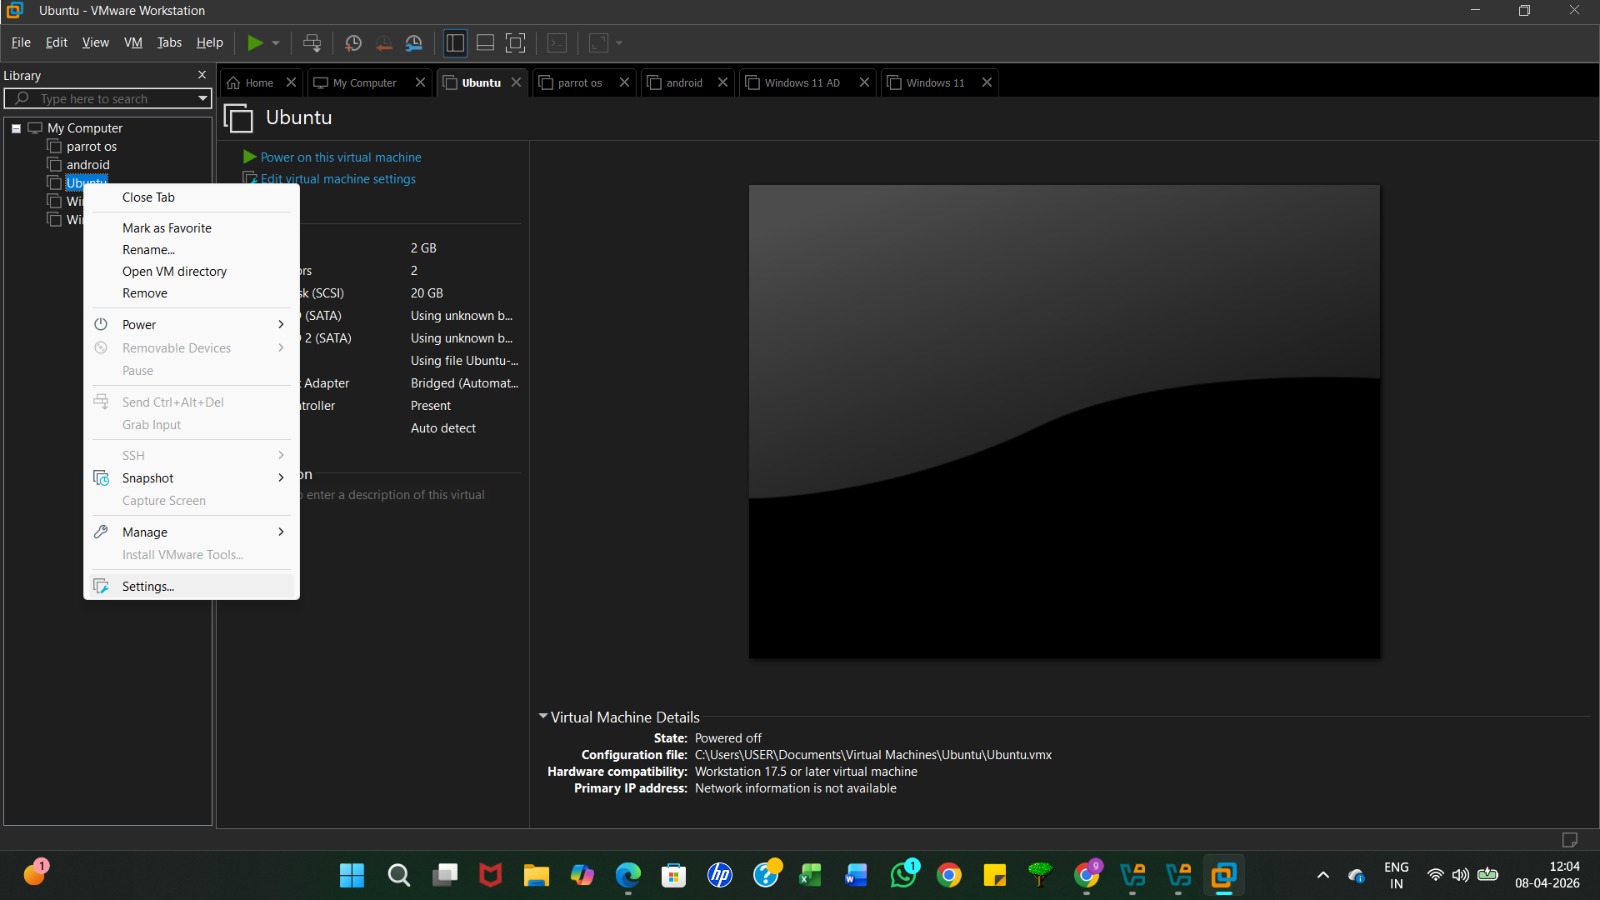
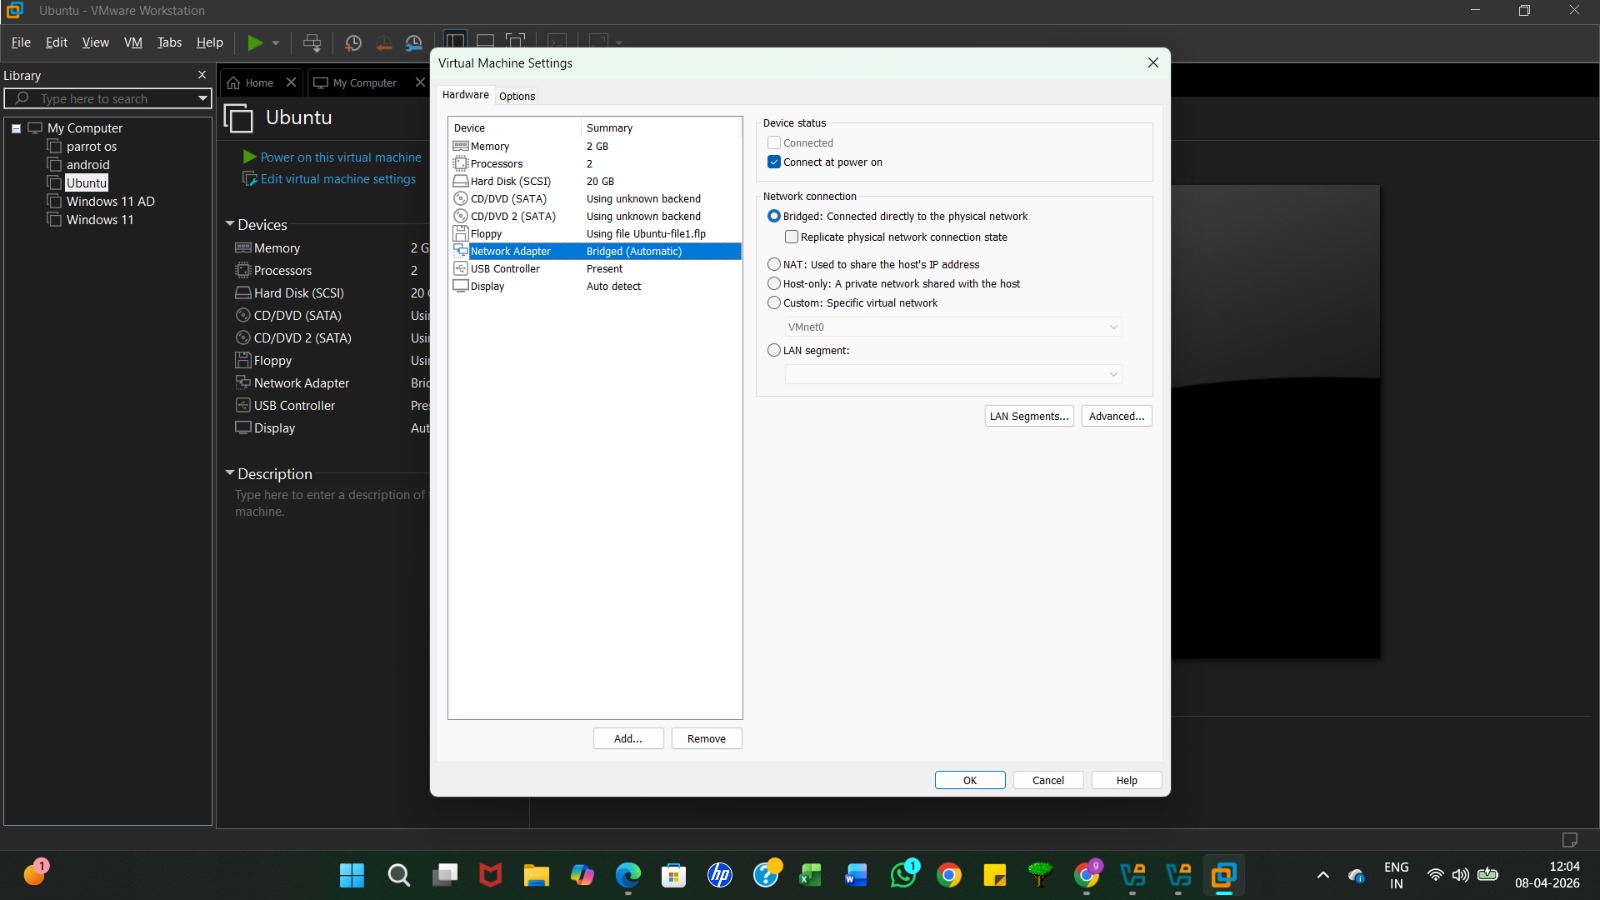
Right-click the Ubuntu VM and select Settings to ensure the network configuration matches the Wazuh server's environment.Under Network Adapter, select Bridged (Automatic) so the Ubuntu VM can communicate directly with the Wazuh server on your local network
From the Wazuh dashboard, copy the full wget command generated in Step 4, which includes the server IP and the unique agent name.
On your Ubuntu VM, open the terminal application to preparefor the agent installation.
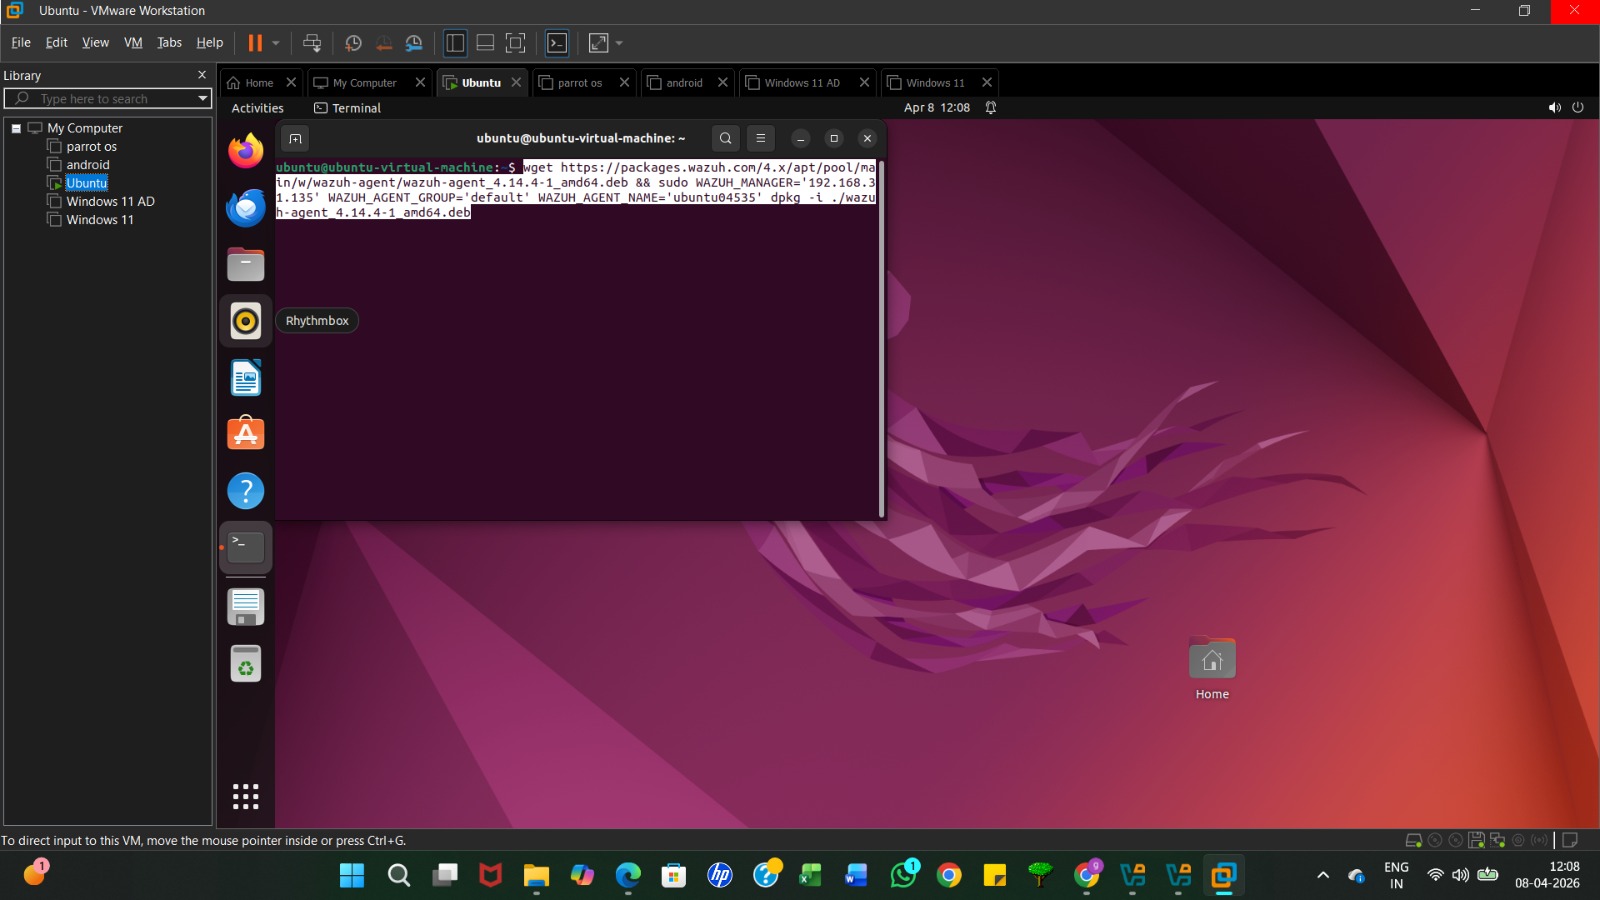
Paste the copied command into the terminal and press Enter. Youmay be prompted to enter your Ubuntu sudo password to continue.
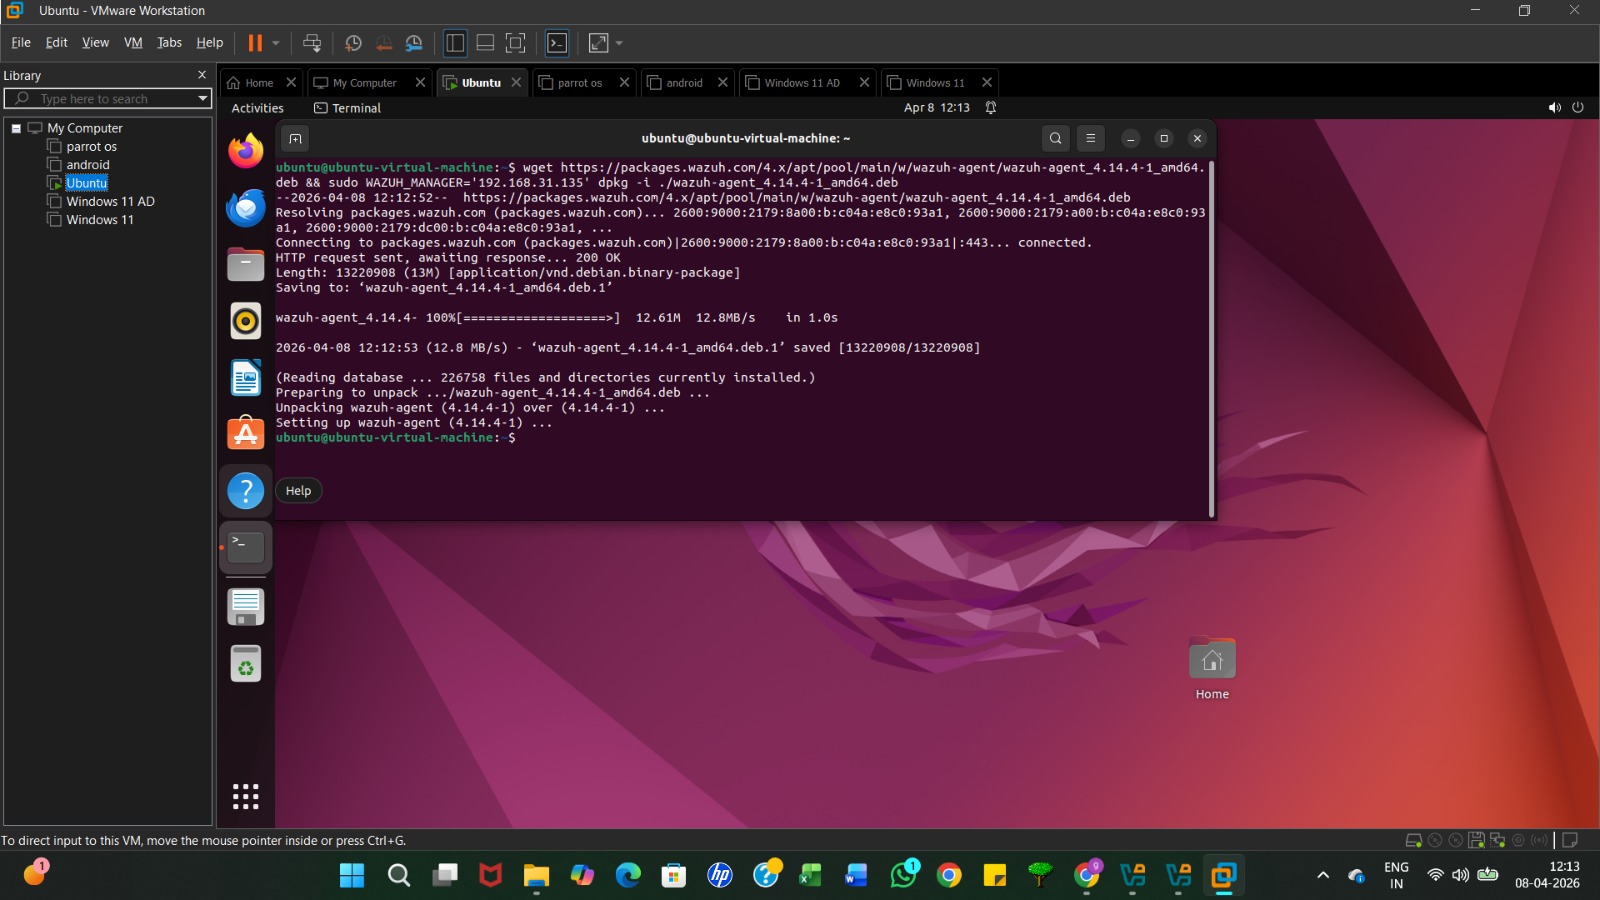
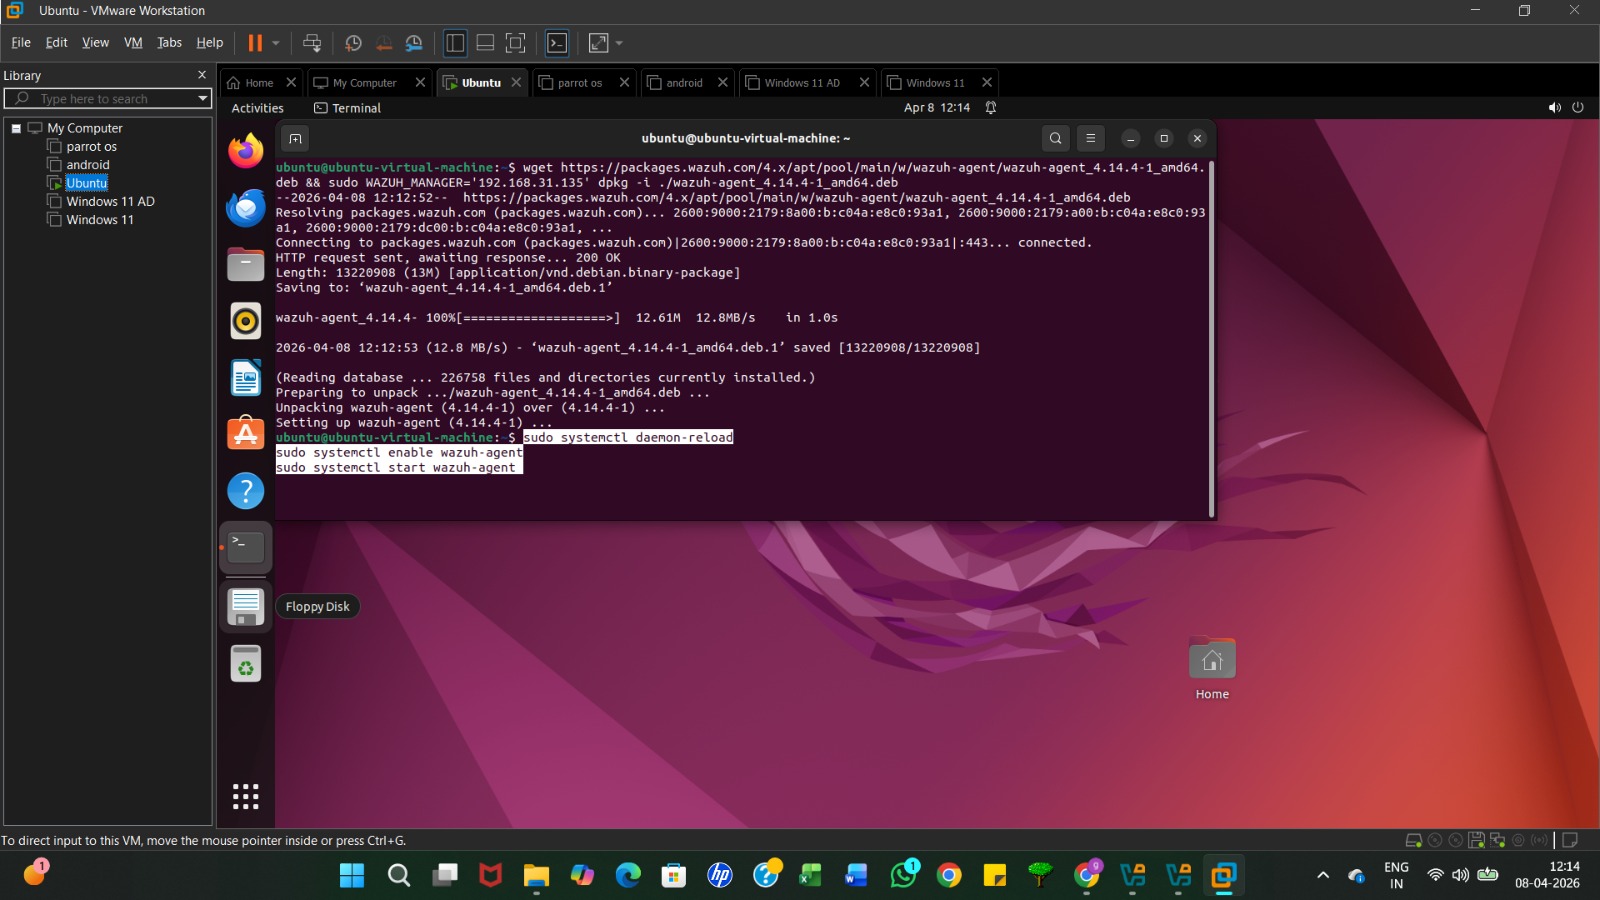
The terminal will display the download progress and package unpacking; wait for the command prompt to reappear, indicating the installation is complete
Return to the Wazuh dashboard and copy the three commands under the "Start the agent" section
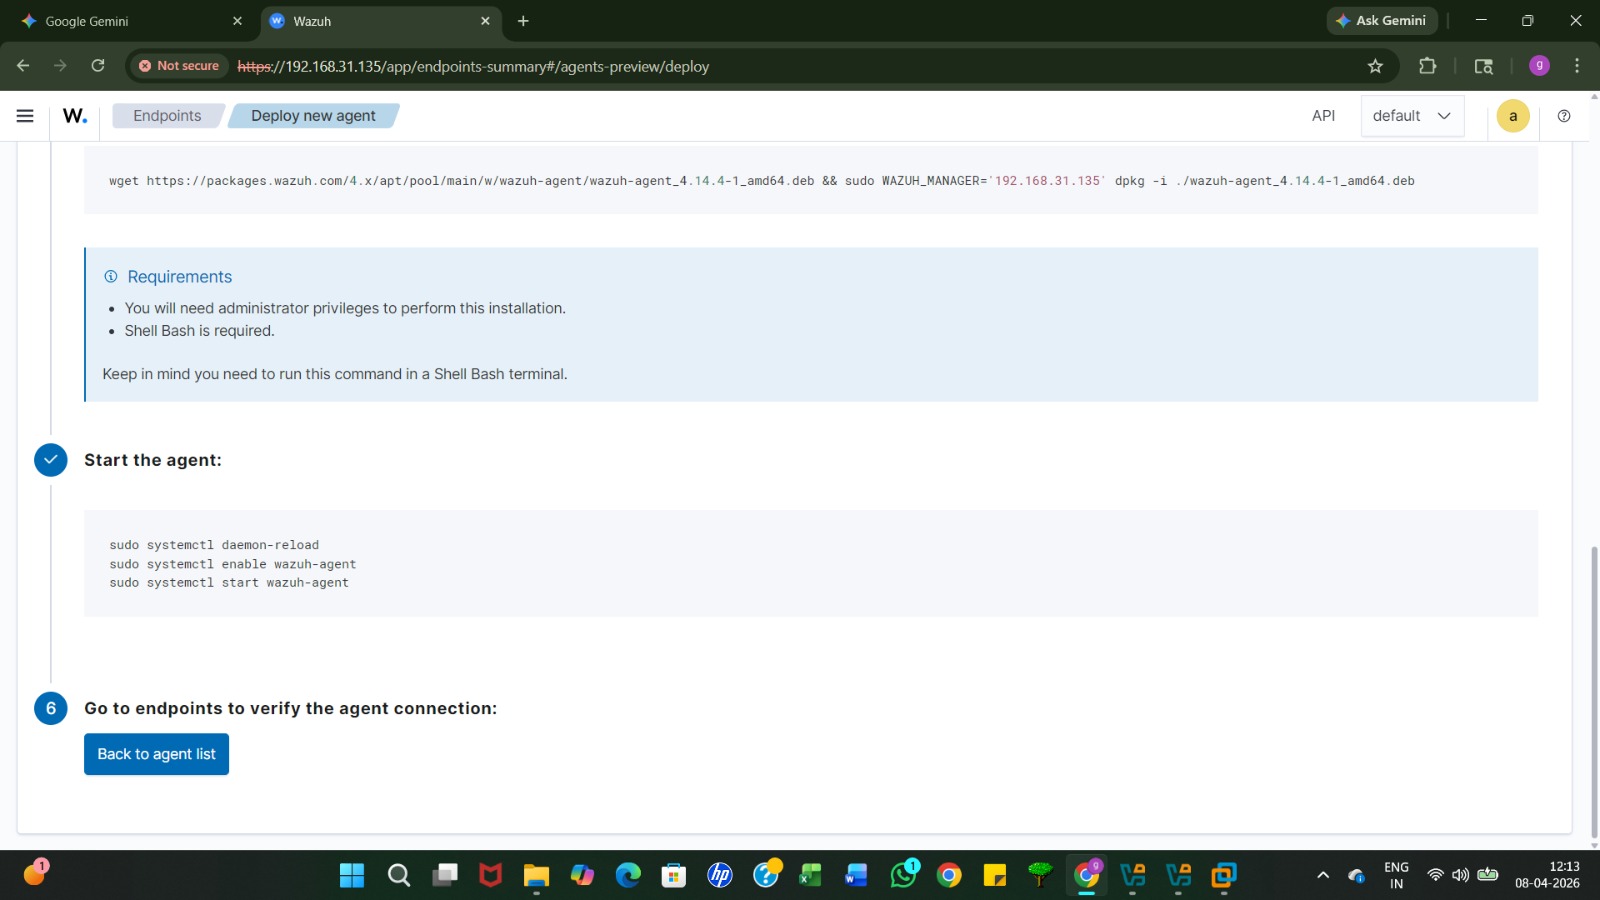
Paste and run the commands to reload the daemon and start the wazuh-agent service on your Ubuntu machine.
Once the service is started, click the "Back to agent list" button on the dashboard to verify the connection.
In the main Overview dashboard, the "Agents Summary"will now show one green, confirming your Ubuntu VM is now being monitoredby Wazuh. Active agent in
Summary
This tutorial provides a step-by-step guide for students to deploy Wazuh using a pre-configured OVA. It covers server installation in VirtualBox, network configuration, and dashboard access. Finally, it demonstrates how to enroll a Linux endpoint, install the monitoring agent, and verify active security monitoring via the centralized web interface
Wazuh Installation & Configuration
Created by: NAVAL KISHOR V

NAVAL KISHOR V
CEH v13 Bsc.Computer Science